A Deep Dive into the 2016 House of Representatives General Election Campaign Finances
Introduction
This entire project started with one question: does the candidate who spends more money during a campaign end up winning that election?
However to avoid this project ballooning in scope and complexity, I had limit myself to the House of Representatives 2016 General Election. I choose to the House of Representatives because it has a larger number of concurrent elections, 435 compared to 50 in the Senate or one for President. I choose the 2016 election because, as of this writing, it is the most recently published election results on the Federal Election Commission’s (FEC) website. I also choose to limit my analysis to the General Election in order to avoid additional complexity arising from the variation in how each state runs their Primary Elections.
Lastly, I choose to limit my analysis to the finances related to the candidate’s principal committee, more on this later.
All of the codes and graphs can found on GitHub. Feel free to download the data sets and perform your own analysis.
Defining FEC Terms and Regulations
To make this analysis more understandable, some FEC terms need to be defined and some FEC regulations explained.
The FEC states that “an individual running for federal office must register and file financial reports when he or she raises or spends more than $5,000 in contributions or expenditures.” At which point “all such candidates must register with a Statement of Candidacy (Form 2) and designate a principal campaign committee within 15 days of becoming a candidate as described.”
For completeness a contribution (“taking in receipts”) is anything of value (money, goods, services or property) received by a political committee. Think fundraising.
And an expenditure (“making disbursements”) is a purchase, payment, distribution, loan, advance, deposit or gift of money or anything of value made for the purpose of influencing a federal election. Expenditures usually include paying for campaign headquarters, paying staff, running election ads and events, among many other things.
There are limits on how much a donor can give a candidate’s committee as well as whether or not the committee needs to itemize the donation. Donations need to be itemized if or once a donor gives more than $200, then referred to as an itemized contribution. Donations less than $200 are not required to be itemized and are known as unitemized contributions.
Each of these candidates should have a principal campaign committee ( authorized committee, or House committee ) which “has been authorized by the candidate to accept contributions or makes expenditures on his or her behalf.”
It is these principal committees that provide the insight into how much money a candidate raised and spent over the course of an election.
There are of course other types of committees that raise and spend money with the hope of influencing an election. Perhaps most notably are the independent expenditure-only committees, or more commonly known as Super PACs. Like stated above, this analysis will solely focus on principal committees however I do have plans to analyze the finances of other committees in the future.
Lastly, during the course of a campaign, each principal committee is required to file periodic reports ( FEC Form 3 ) detailing the total receipts (money, goods, etc. received) and the total disbursements (purchases, payments, etc. made) for the specified interval. These reports are filed quarterly, and leading up to both the primary and general elections.
Adding up the total receipts and the total disbursements for all reports filed will give us the grand total raised and spent over the course of the election.
Gathering the Data
The diagram below outlines, at a high-level, how the data was gathered and combined.
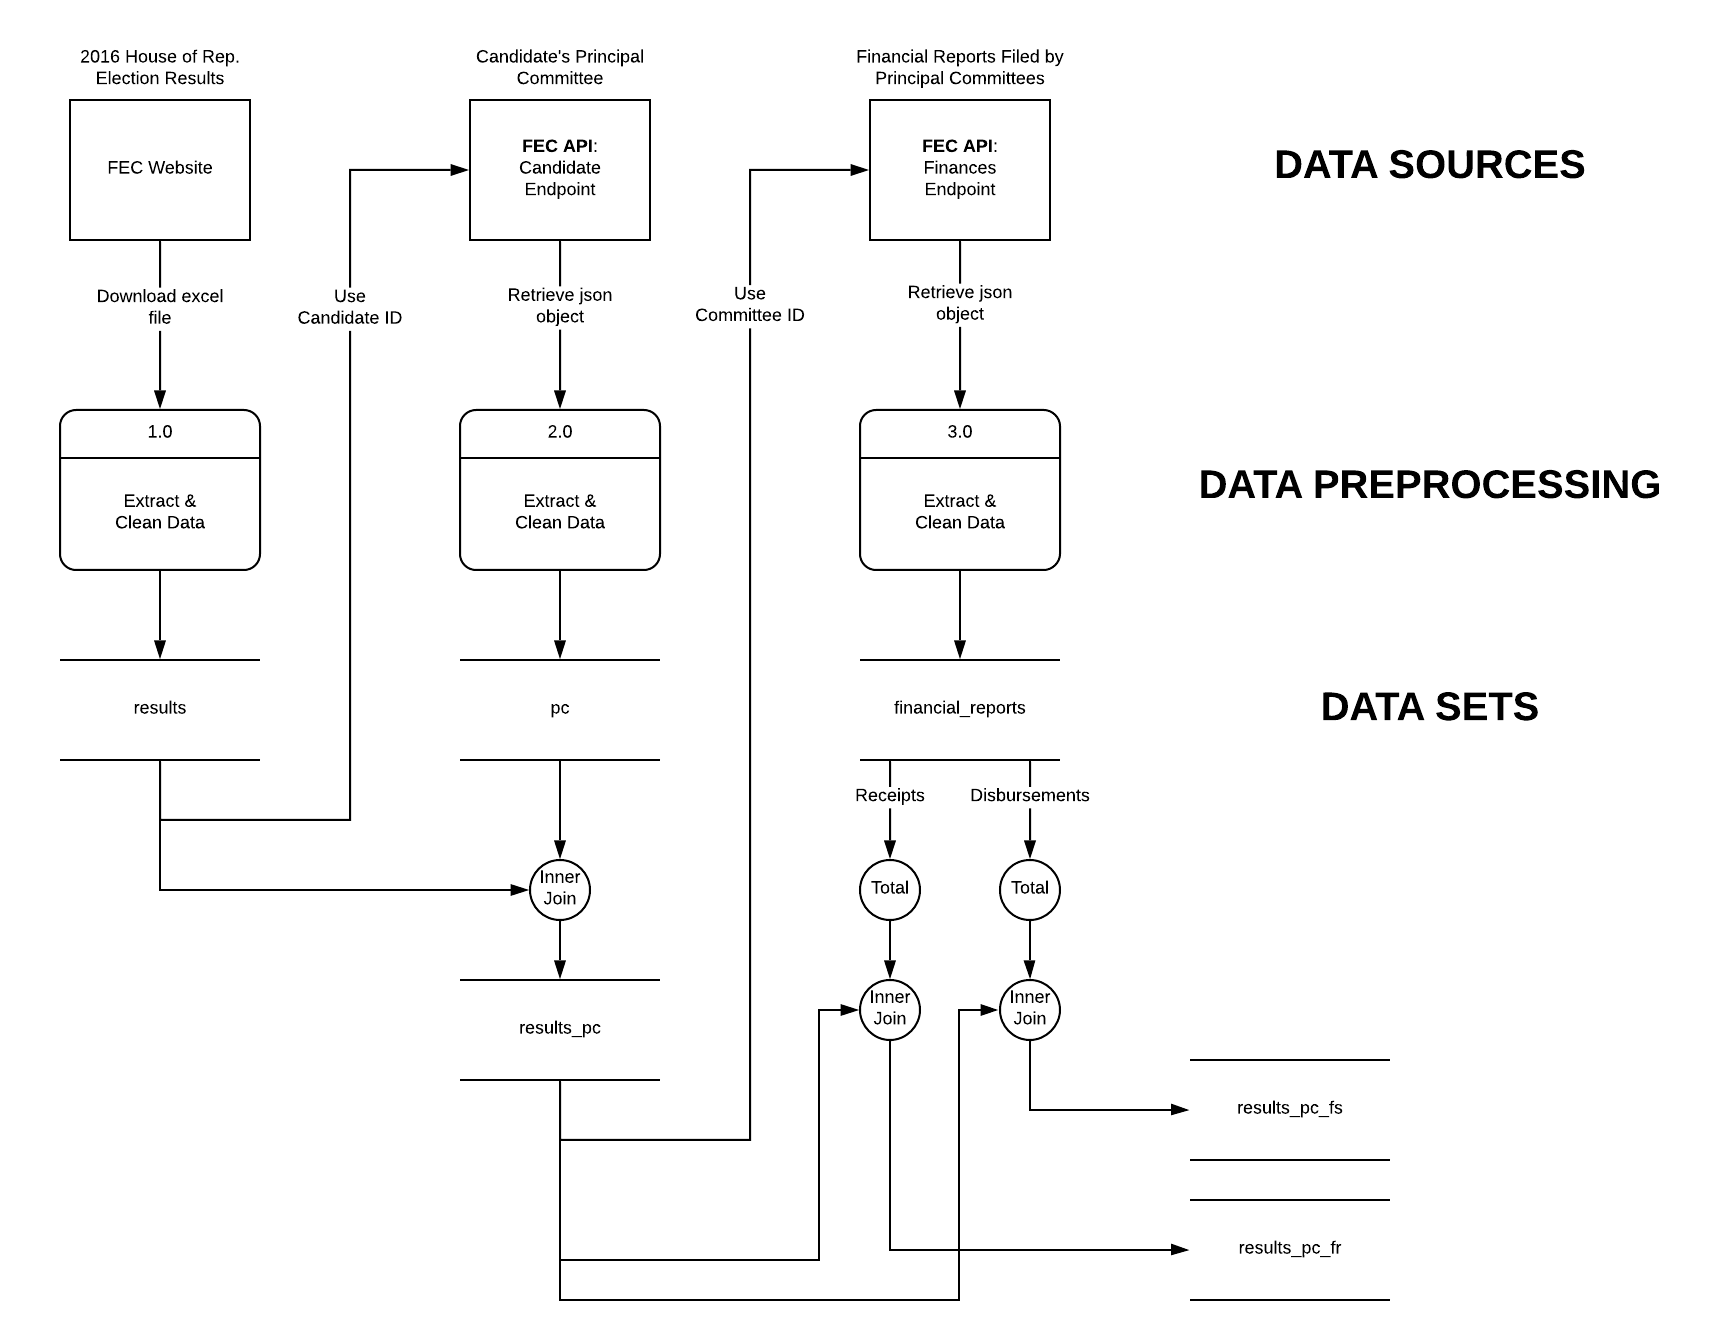
Diagram 1: Gathering, Cleaning and Combining Data
The 2016 Election Results data set was downloaded as an excel spreadsheet from the FEC
website. The relevant information was extracted and cleaned and is refered to as results.
The results data set contains the candidate IDs for each candidate which, along side the
OpenFEC API candidate endpoint, allows us to retrieve more information on each candidate, such as their respective principal committee ID.
Once the principal committee IDs are gathered, we can create a new data set which consists of the information from the results data set along with each candidate’s respective principal committee ID, pc. This new data set is referred to as results_pc.
Now let’s look at the percentage of candidates for whom we were able to find principal committee information.
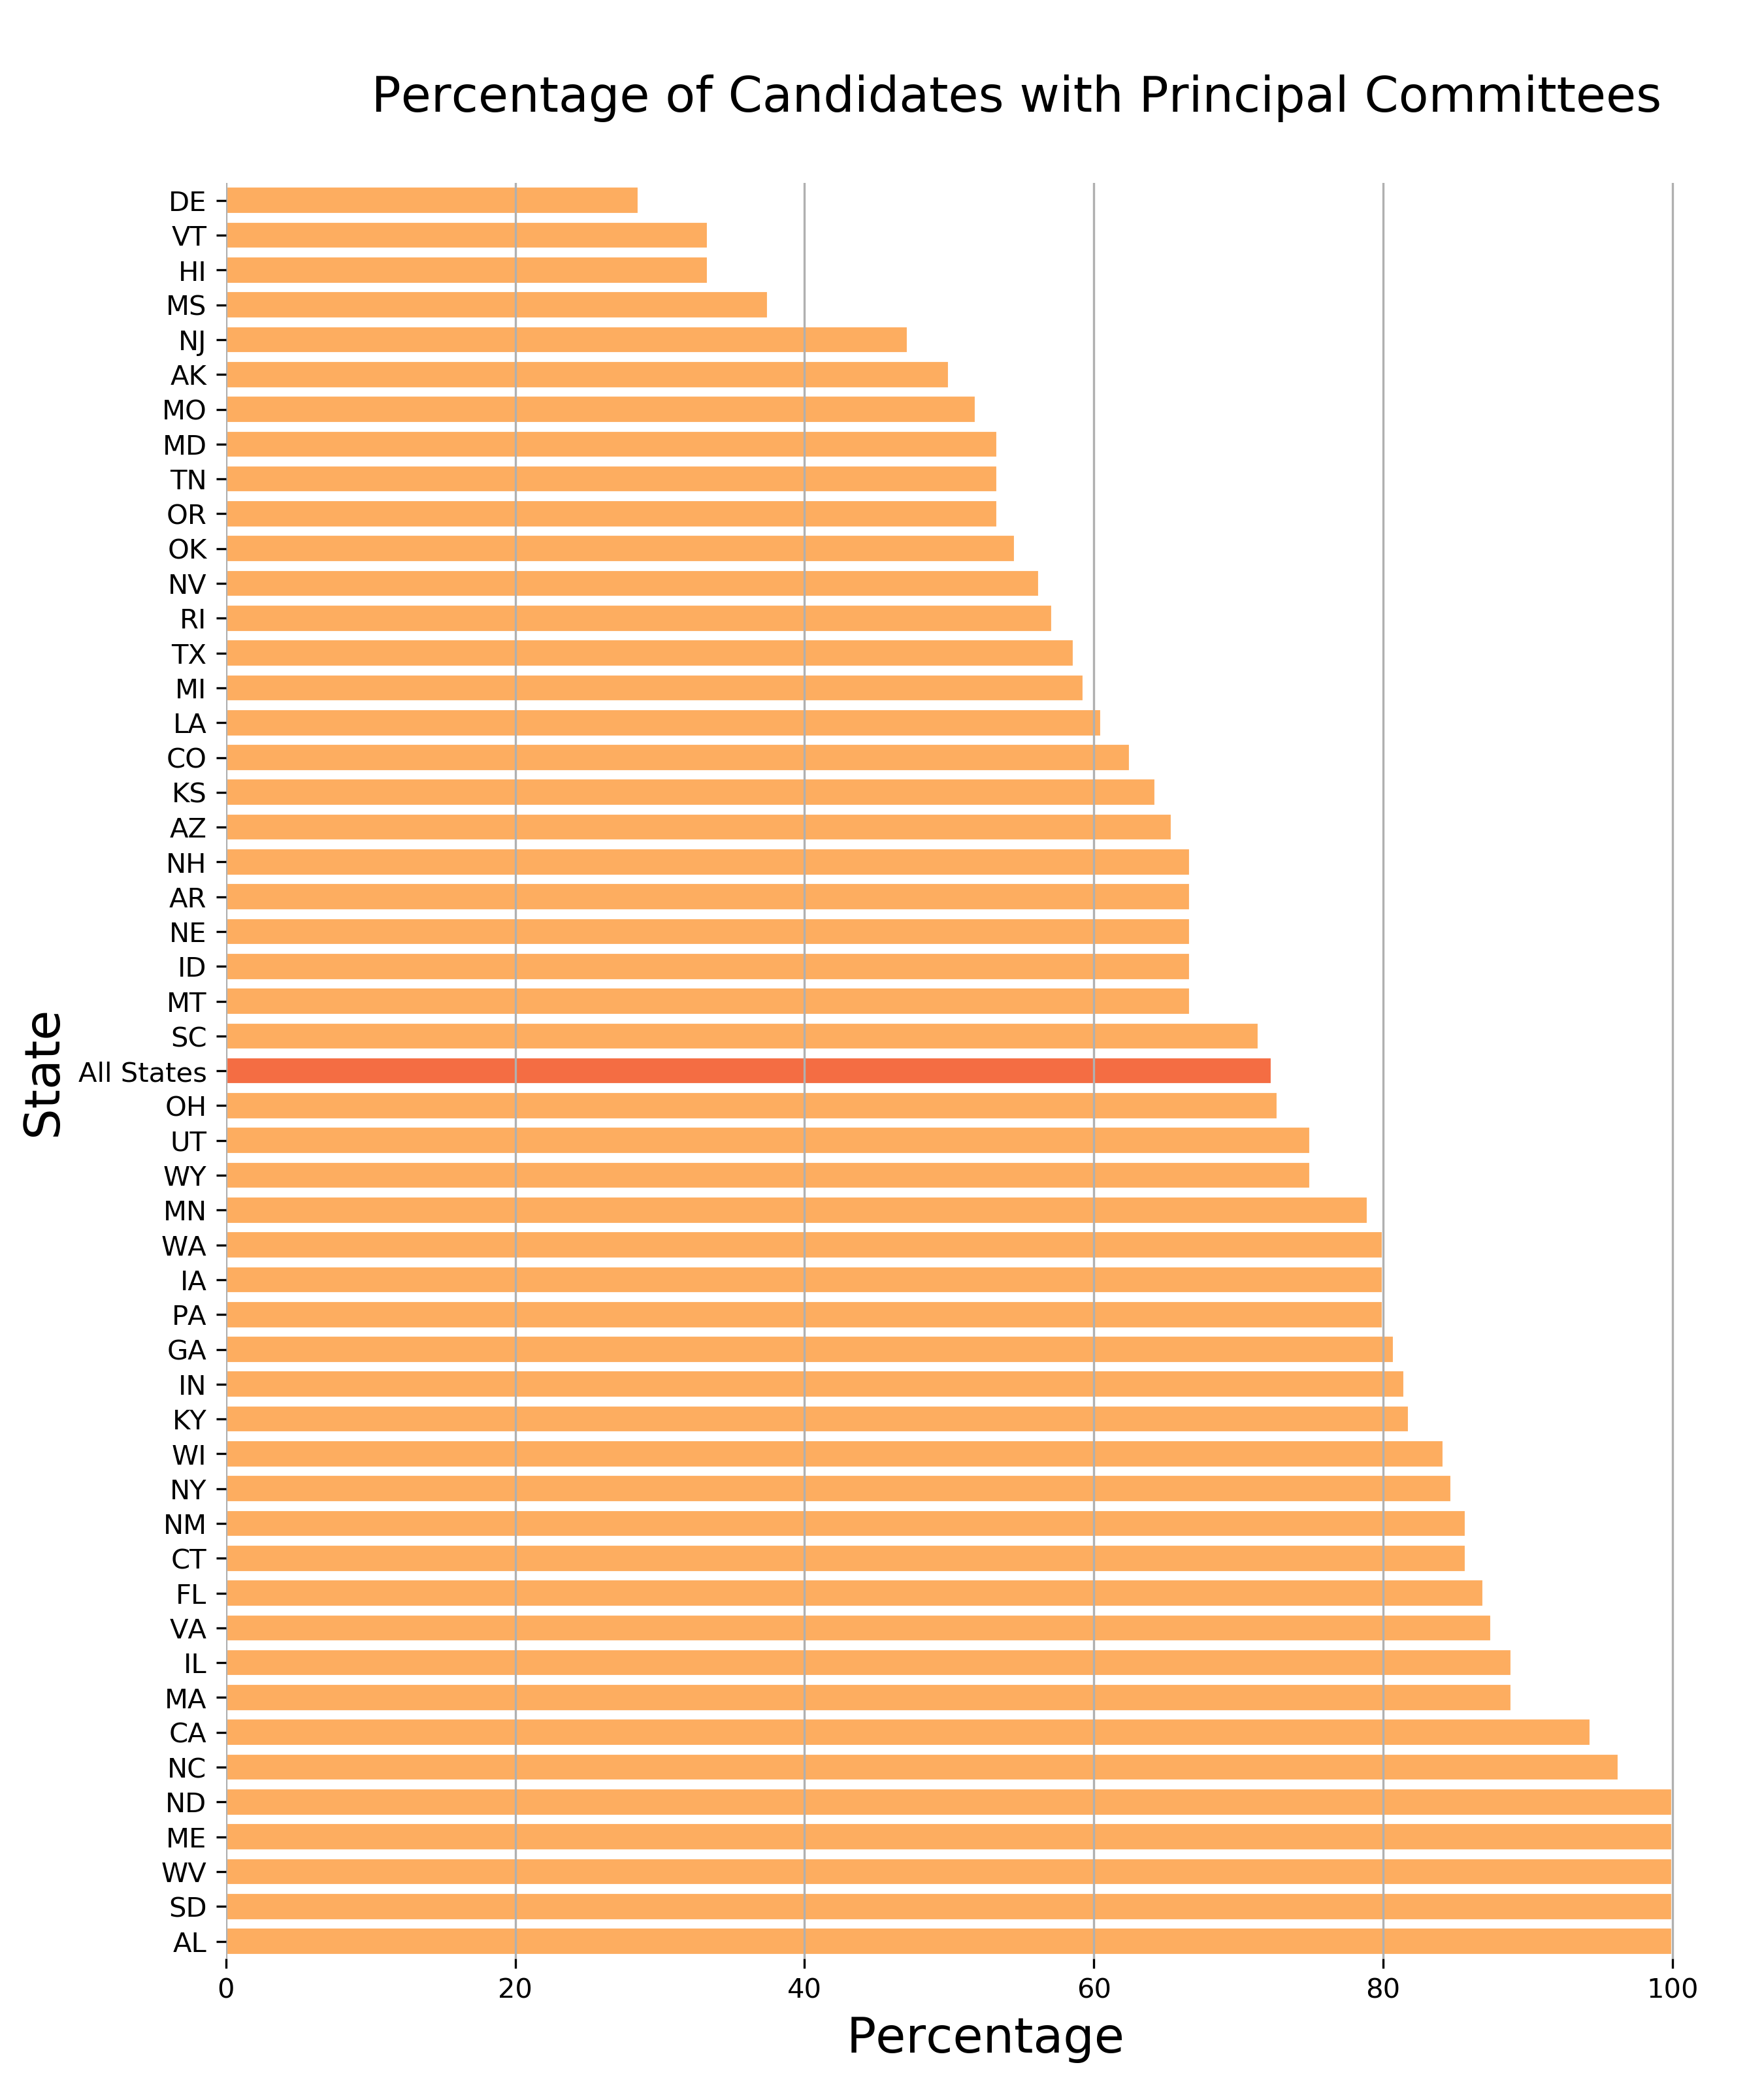
Chart 1: Percentage of Candidates with Principal Committees
There might be a few reasons why a candidate received general election votes but doesn’t have a prinicpal committee.
I believe the most plausible explanation is that the candidate never filed a Statement of Candidacy because they never reached the $5000 threshold. The FEC then retroactively assigned a candidate ID because they appeared on the ballot.
There might have been candidates who filed a Statement of Candidacy but never authorized a principal committee. Or the candidate might have neglected to follow the FEC regulations and ran a campaign without ever notifying the FEC. I believe these last two explanations to be unlikely, and even more so if the candidate ended up winning the election.
Next, we can then use the API financials endpoint along with each principal committee ID to retrieve the details about each Form 3 filed by that principal committee during the 2016 election cycle.
We might expect to see a few candidates who did file a Statement of Candidacy but not report their spending to the FEC. The chart below indicates just this. This percentage can be no greater than the percentage of candidates who have principal committees.
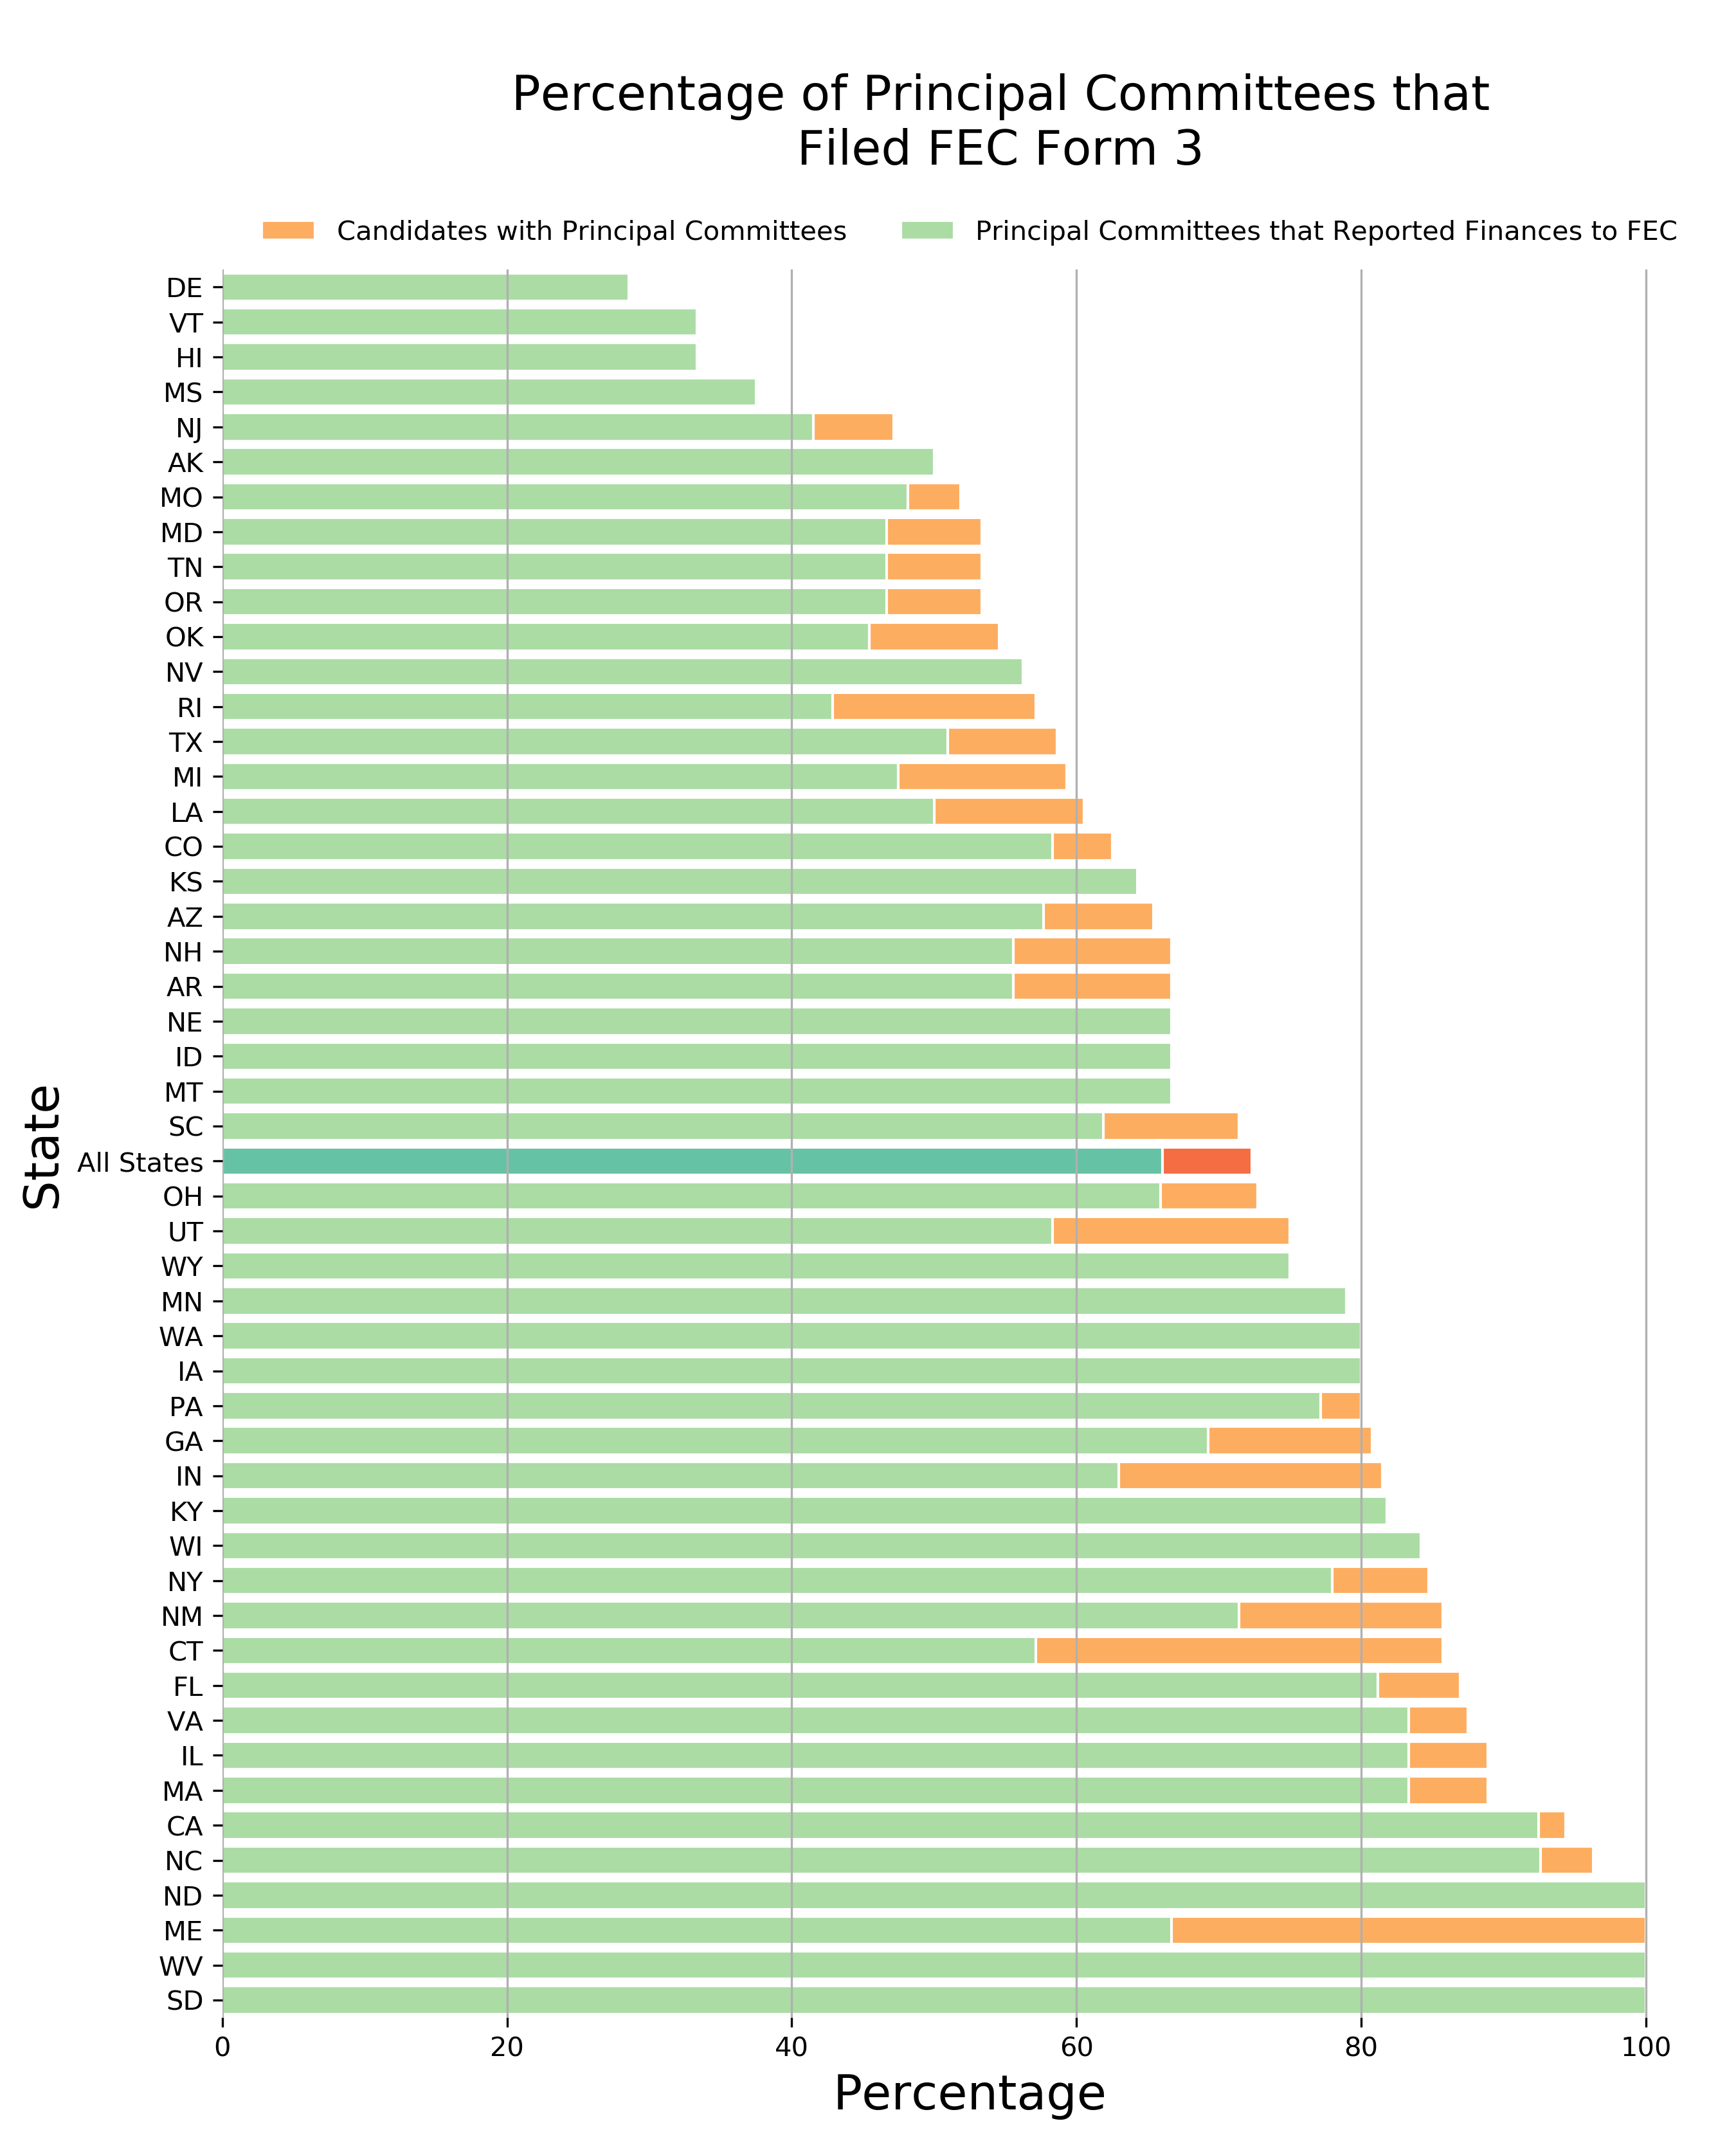
Chart 2: Percentage of Principal Committees that Filed FEC Form 3
Since the goal of this analysis is to determine whether spending more on a campaign results in winning the election, it is vital that we have information about a candidates spending during the campaign. Going forward, I think it is safe to assume that all the candidates that don’t have principal committees or those who do but didn’t report their spending to the FEC (Form 3) raised and spent less than $5000.
This assumption will allow us to continue the analysis without those candidates.
We now have a data set which contains information about the candidates, including their principal committee ID, and how they performed in the general election, referred to as results_pc.
We also have another data set which contains all the FEC Form 3 reports filed by each of the principal committees leading up to the general election, referred to as financial_reports. Because these principal committees are reporting their receipts and disbursements many times throughout the year, this data set contains multiple reports (rows) for each principal committee.
However we are only interested in the grand total raised and grand total spent for each principal committee so we can analyze them against the candidates general election results. To do this, I will create two new data sets, one that contains the grand totals for all columns related to receipts per principal committee and one that contains the grand total for all columns related to disbursements per principal committee. Each of these will then be separately combined with the results_pc data set to create two new data sets referred to as results_pc_fr (finances, raised) and results_pc_fs (finances, spent).
The columns from financial_reports that we are interested in are the listed below.
Total Raised is the sum of the following categories:
- Individual Itemized Contributions
- Individual Unitemized Contributions
- Candidate Contributions
- Political Party Committee Contributions
- Other Political Committee Contributions
- Transfers From Other Authorized Committees
- Loans Made By Candidate
- All Other Loans
- Offsets To Operating Expenditures
- Other Receipts
Total Spent is the sum of the following categories:
- Operating Expenditures
- Transfers To Other Authorized Committeees
- Refunded Individual Contributions
- Refunded Political Party Committee Contributions
- Refunded Other Political Committee Contributions
- Loan Repayments Candidate Loans
- Loan Repayments Other Loans
- Other Disbursements
Analyzing the Data
Before diving into calculating and analyzing correlations, let’s get an idea of what percentage of candidates spent the most and also ended up winning their elections.
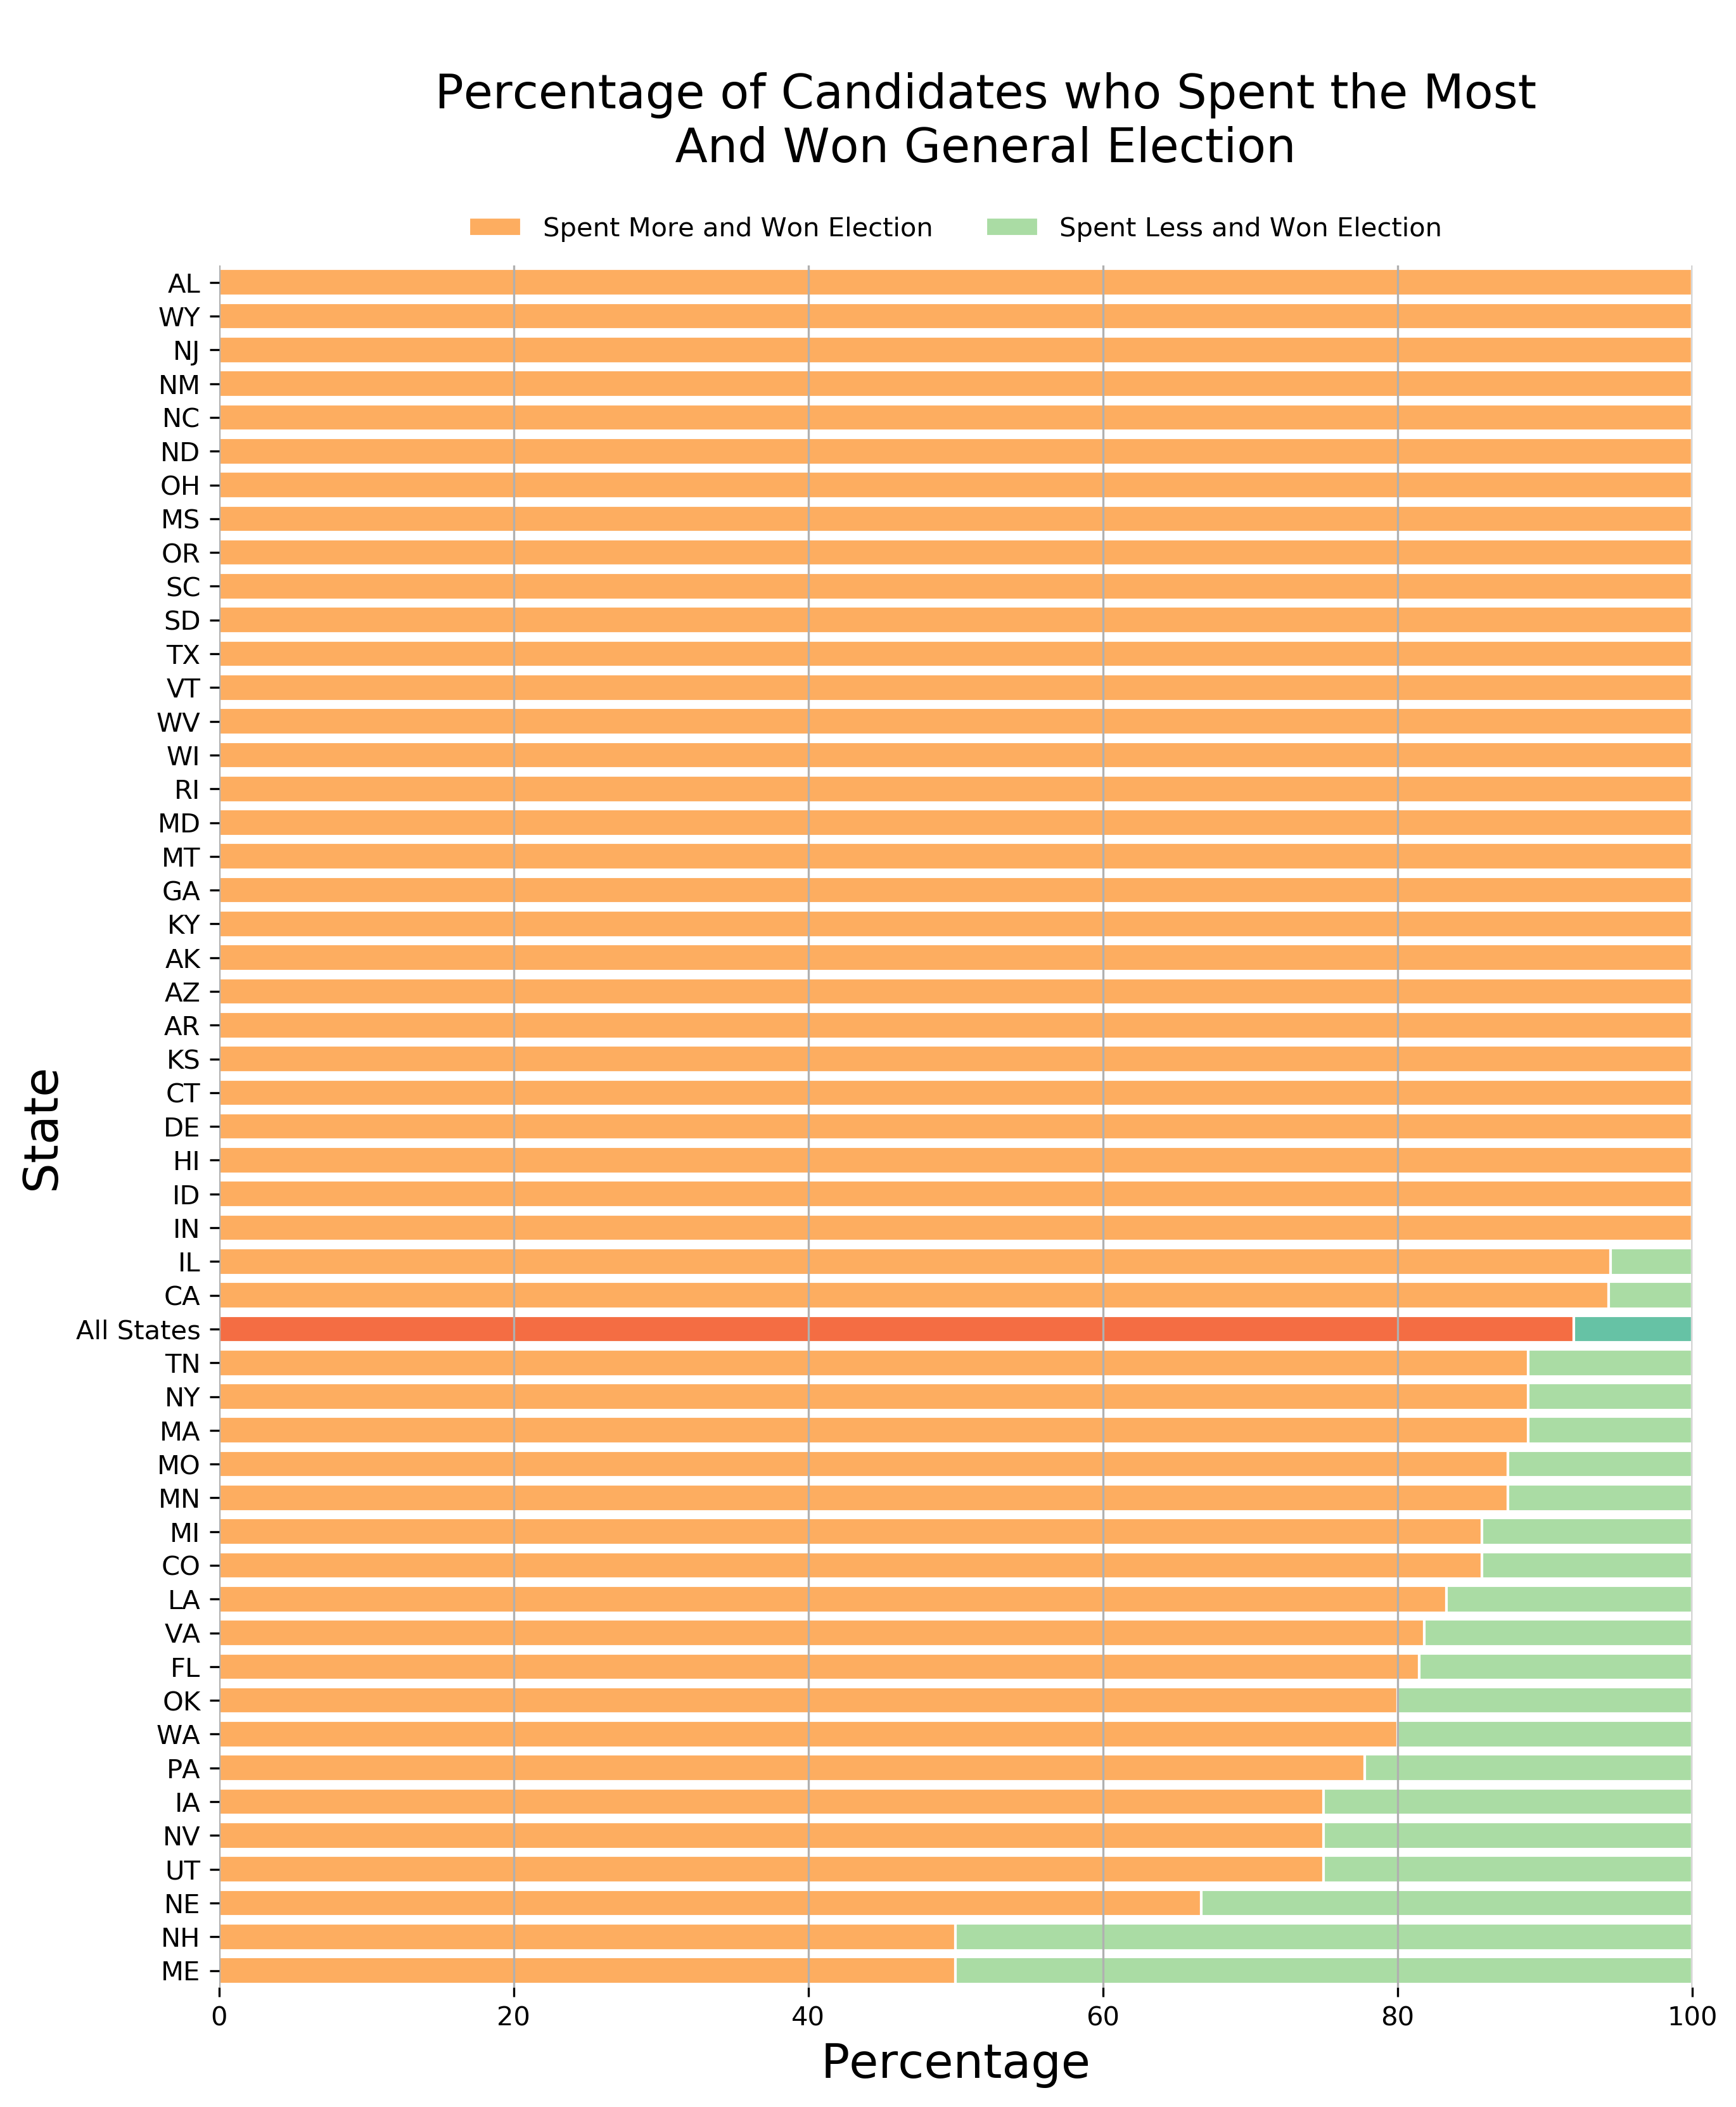
Chart 3: Percentage of Candidates who Spent the Most and Won General Election
Although at this time it’s difficult to make causal claims about whether spending more money during an election cycle has a direct impact on their chances of winning the election, it is clear that the candidates who spent the most money during the 2016 election cycle ended up winning the vast majority of the time. For 29 states, all of the candidates who spent more ended up winning and in 43 states, 80% of the candidates who spent more ended up winning.
There are likely many other confounding variables that haven’t been taken into account but this chart is still fairly shocking and warrants further investigation.
Let’s look at the correlation matrices for the numerical columns in results_pc_fs (disbursements).
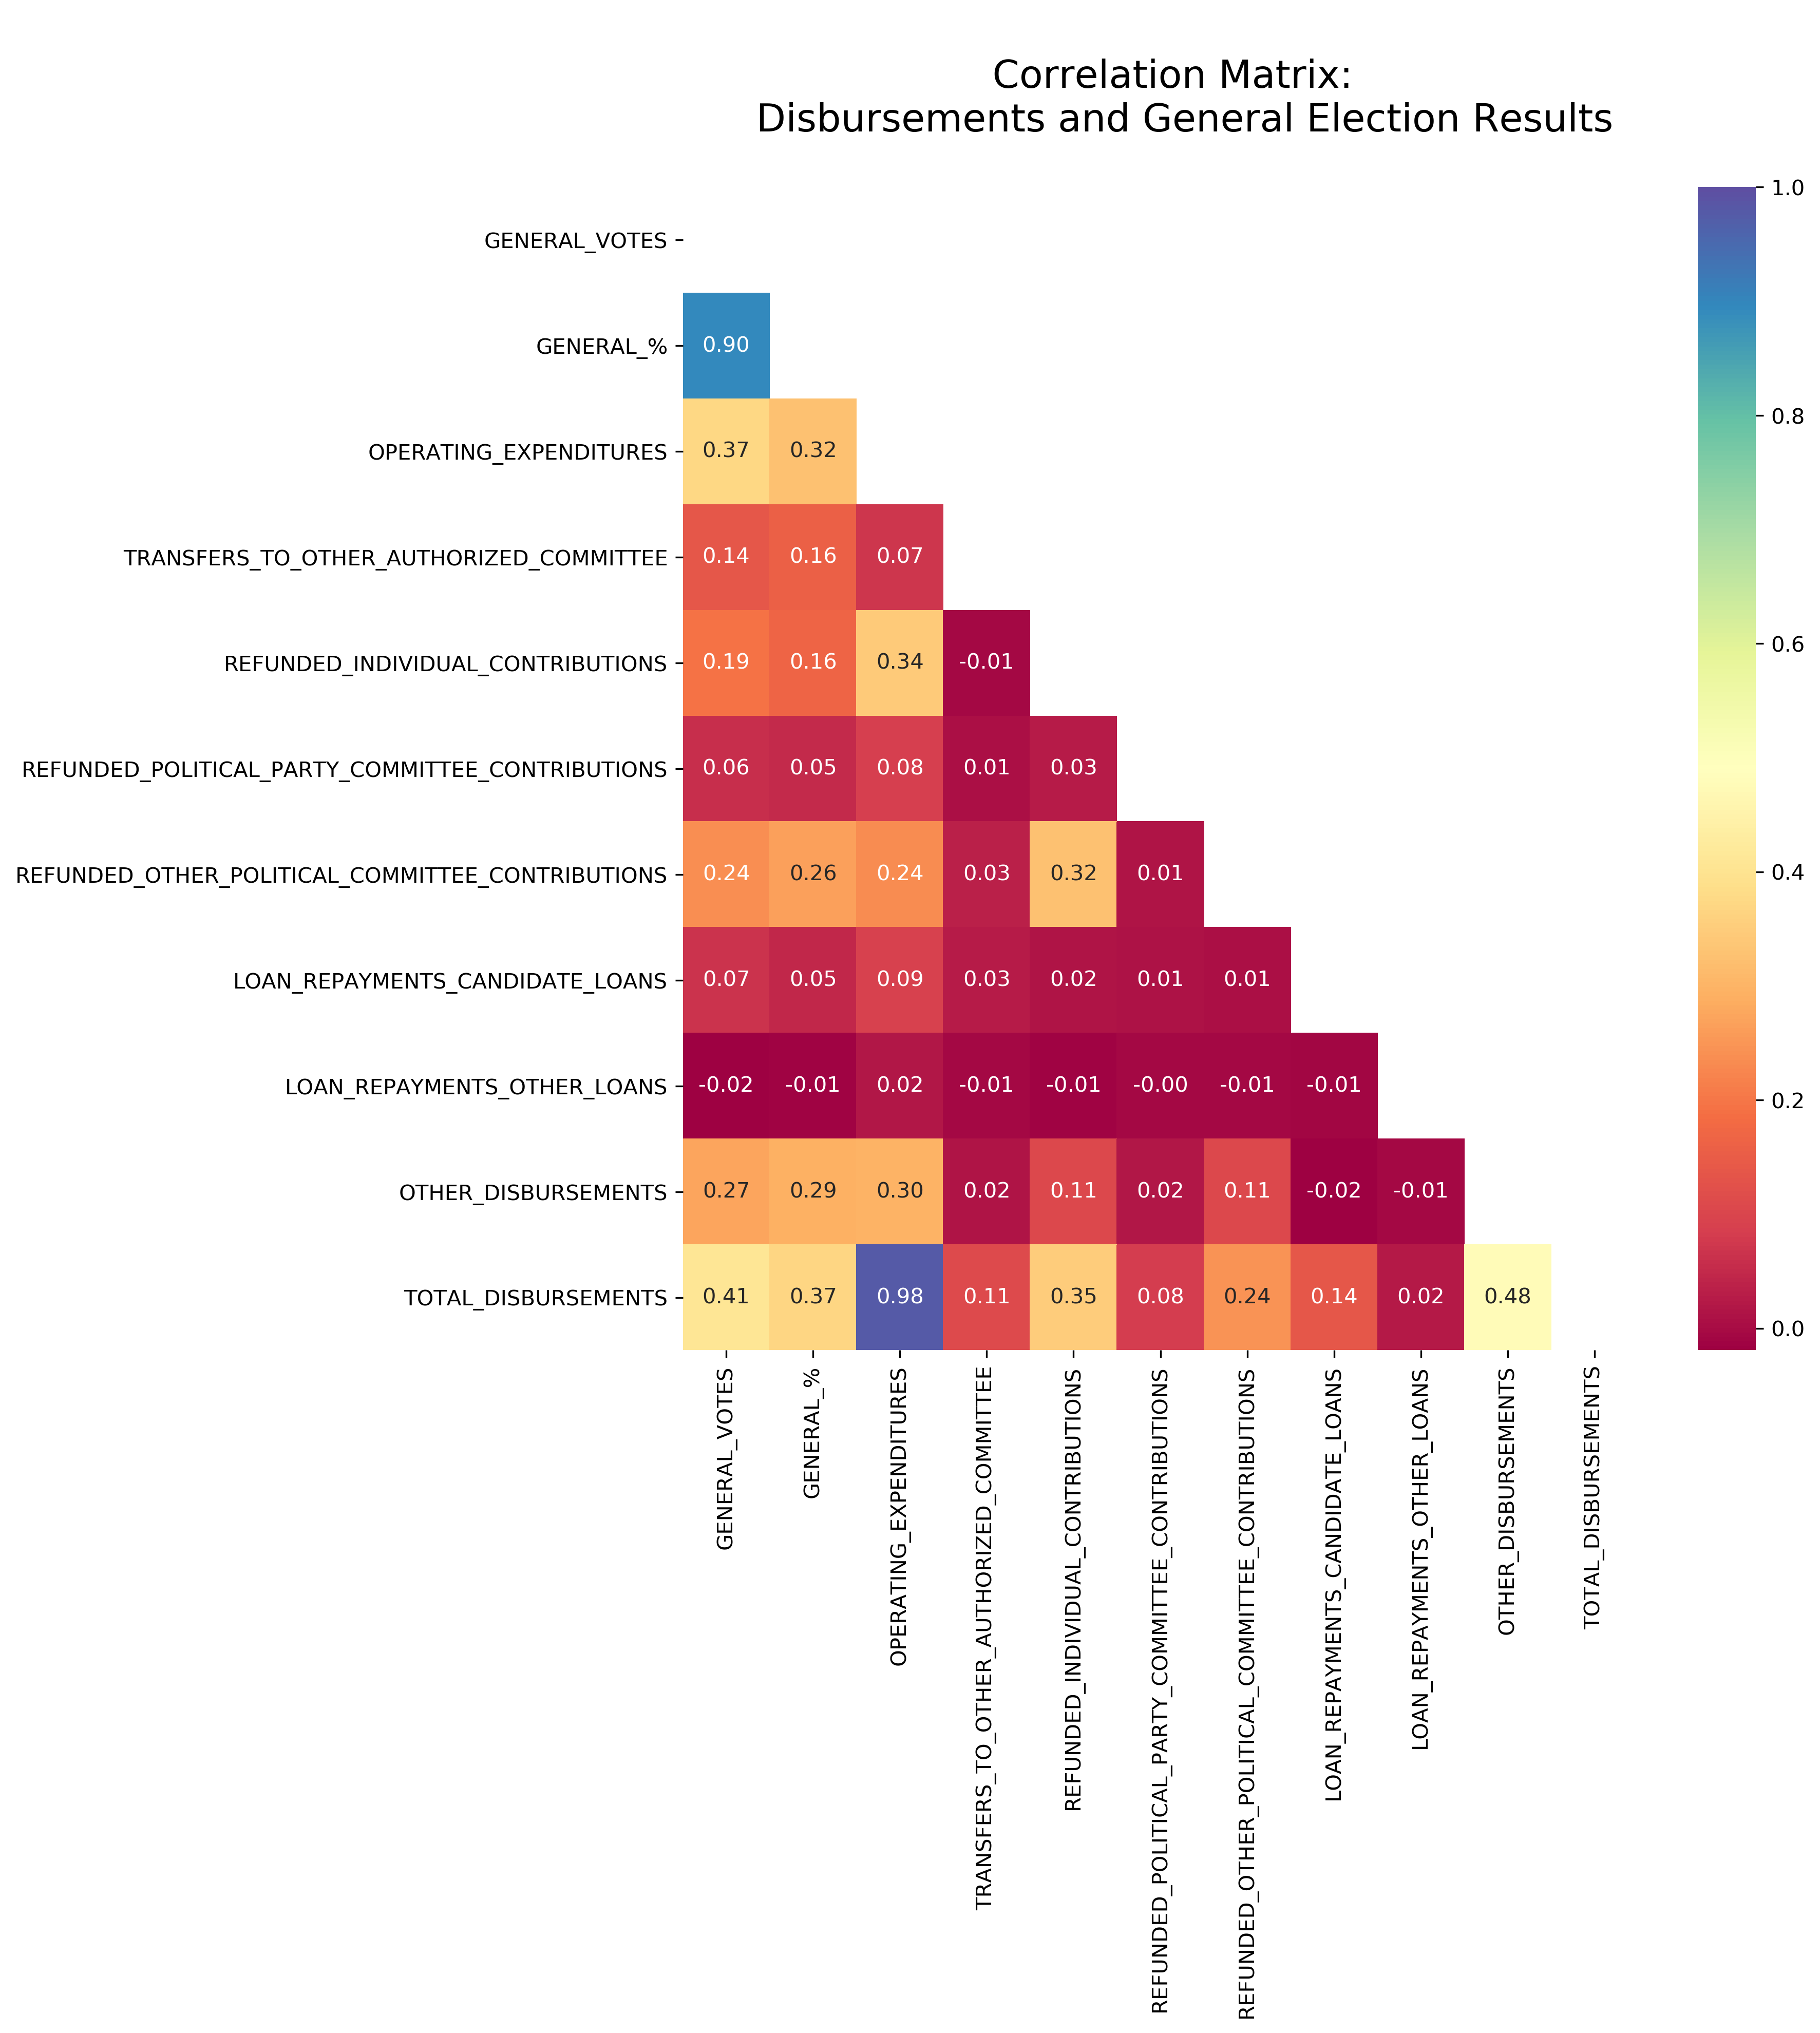
Chart 4: Correlation Matrix: Disbursements and General Election Results
It is clear that there is an extremely strong correlation (r=0.98) between ‘Operating Expenditures’ and ‘Total Disbursements’, which might indicate that a majority of the money spent by the principal committee is on their operating expenses.
This makes sense since operating expenditures represents the vast majority of where the candidates would spent their money (from FEC glossary: ‘day-to-day expenditures for items such as rent, overhead, administration, personnel, equipment, travel, advertising and fundraising’).
There appears to be two columns, ‘Operating Expenditures’ (r=0.37) and ‘Total Disbursements’ (r=0.41), that have a moderate and positive correlation to ‘General Votes’. Let’s explore scatterplots for both of these columns compared to the ‘General Votes’.
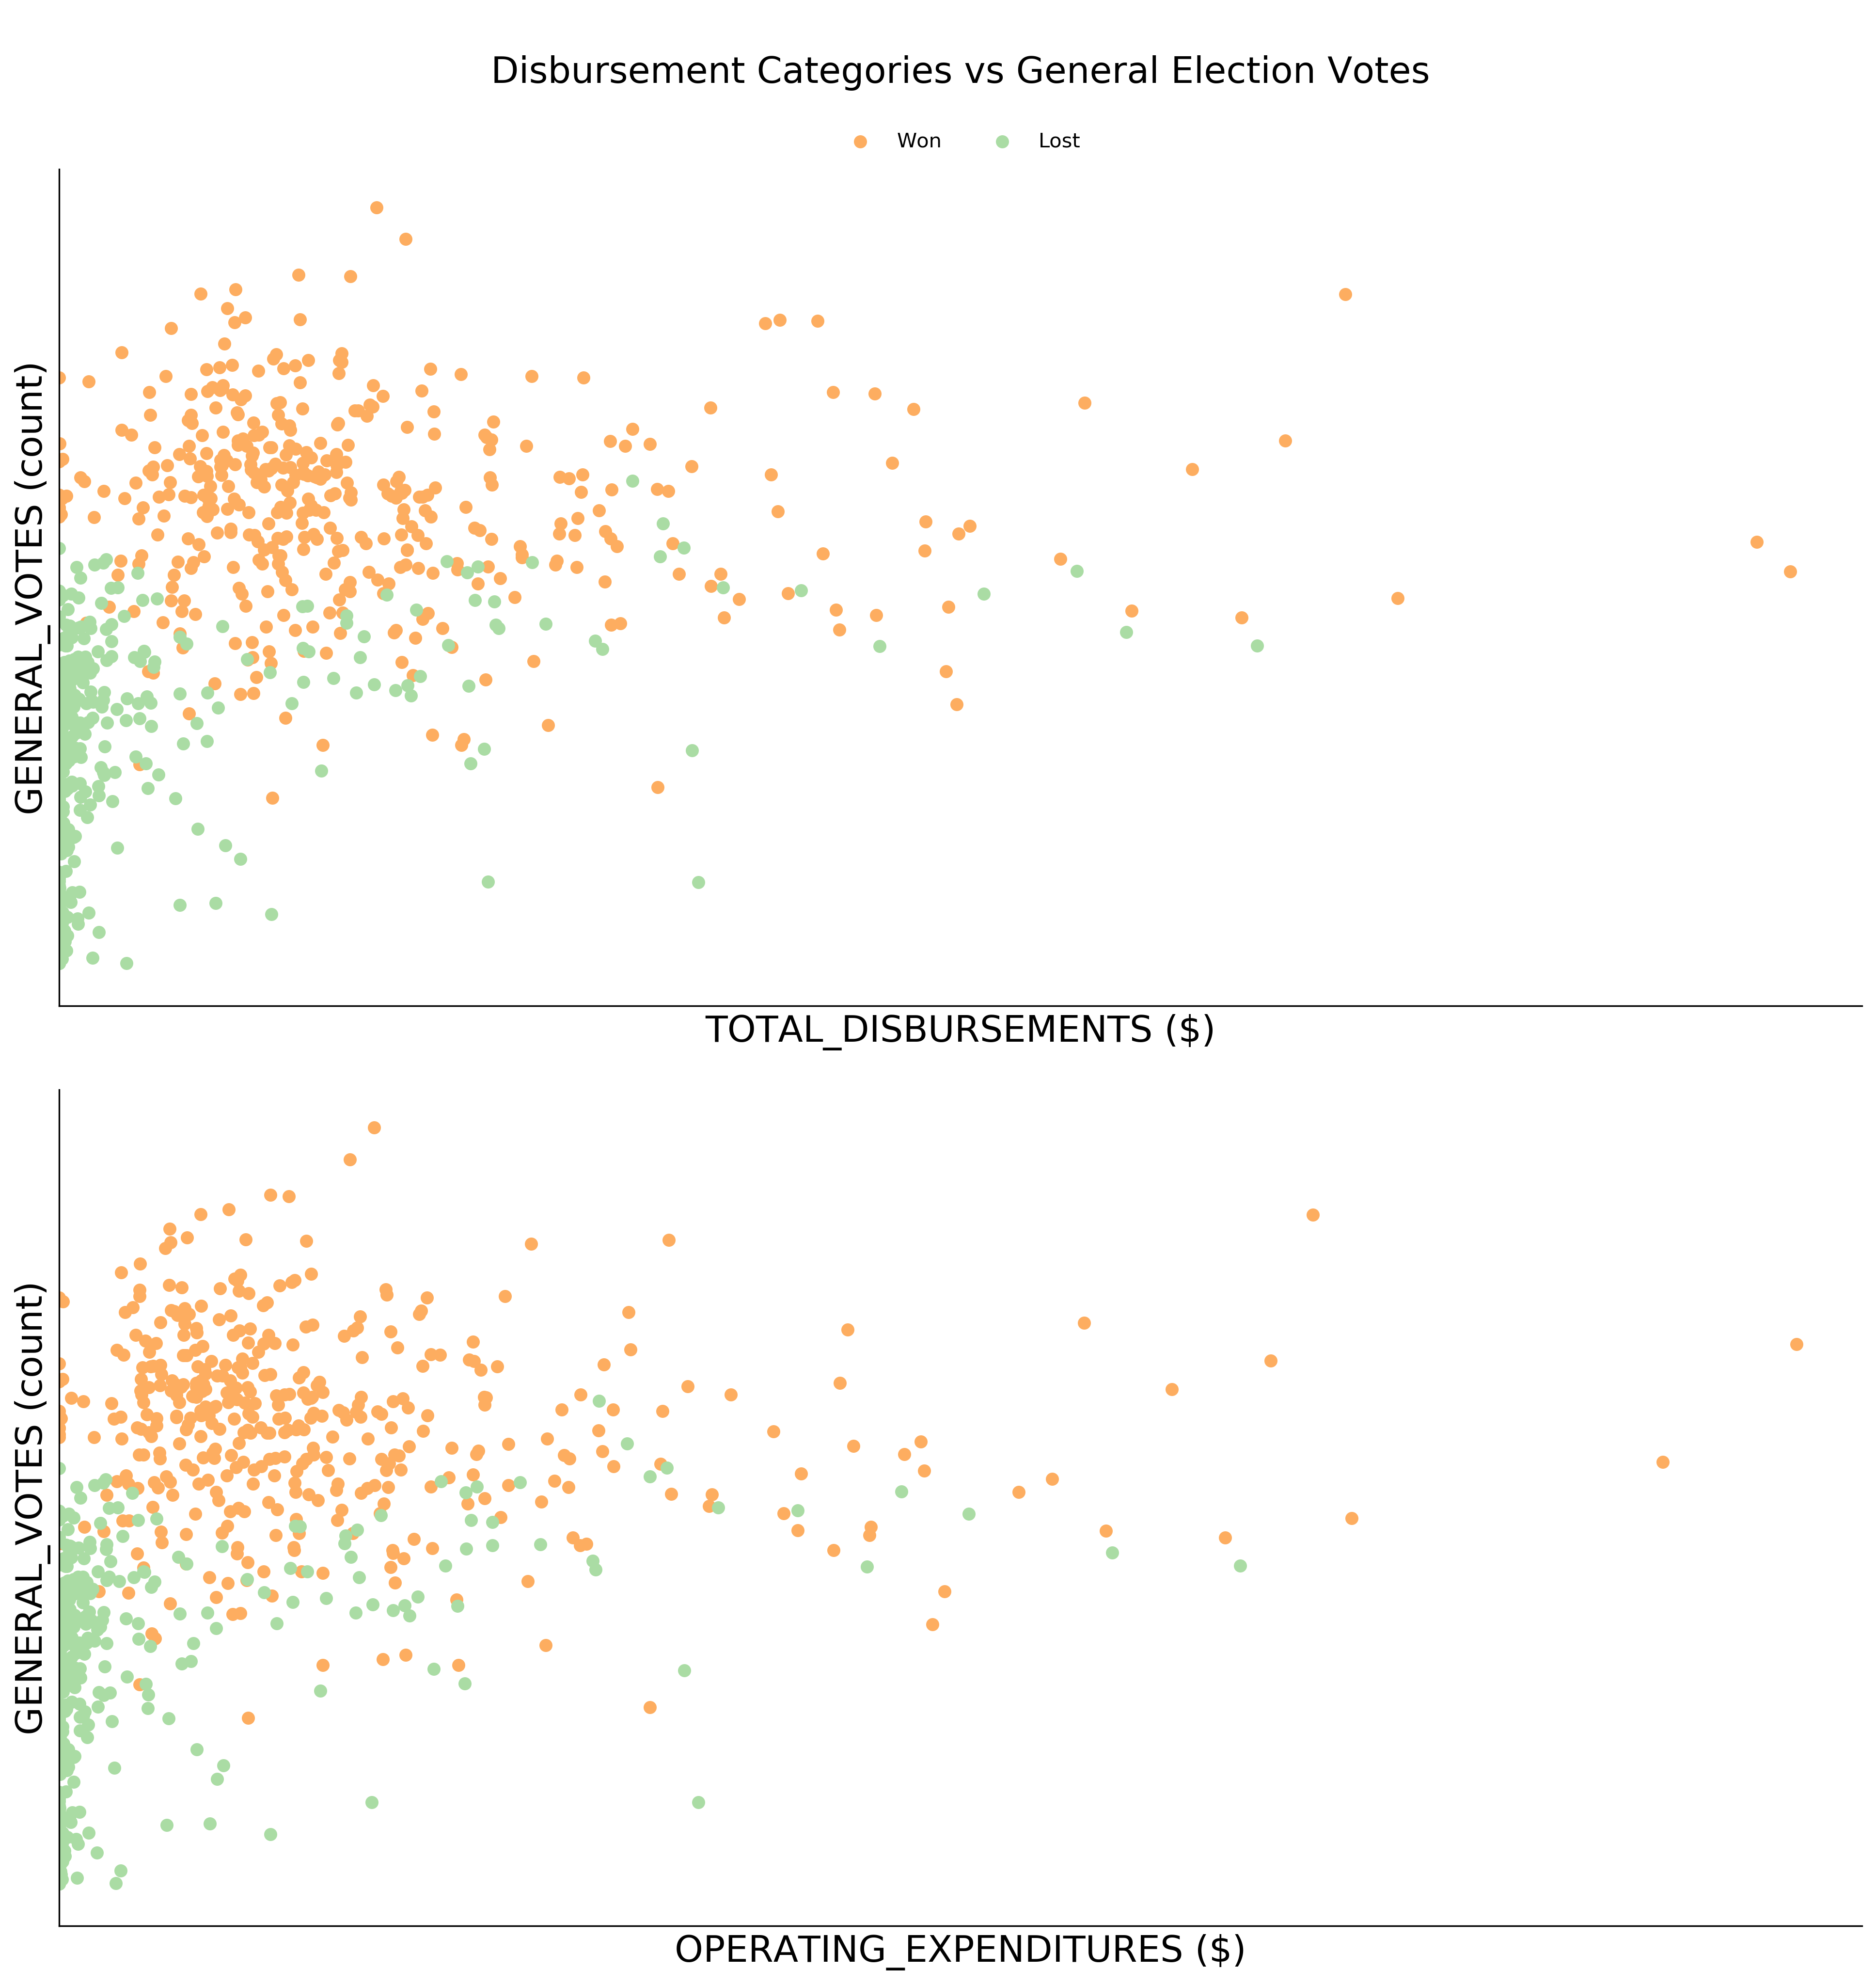
Chart 5: Correlation Matrix: Disbursements and General Election Results
By looking at the scatterplots for both ‘Total Disbursements’ ($) versus ‘General Votes’ (count) and ‘Operating Expenditures’ ($) versus ‘General Votes’ (count), the strength of their respective correlations is less clear. The general election winners, in general, appear to have spent more and received more votes and the reverse appears to be true for the general election losers.
Now let’s take a look at which categories contribute the most to overall total disbursement.
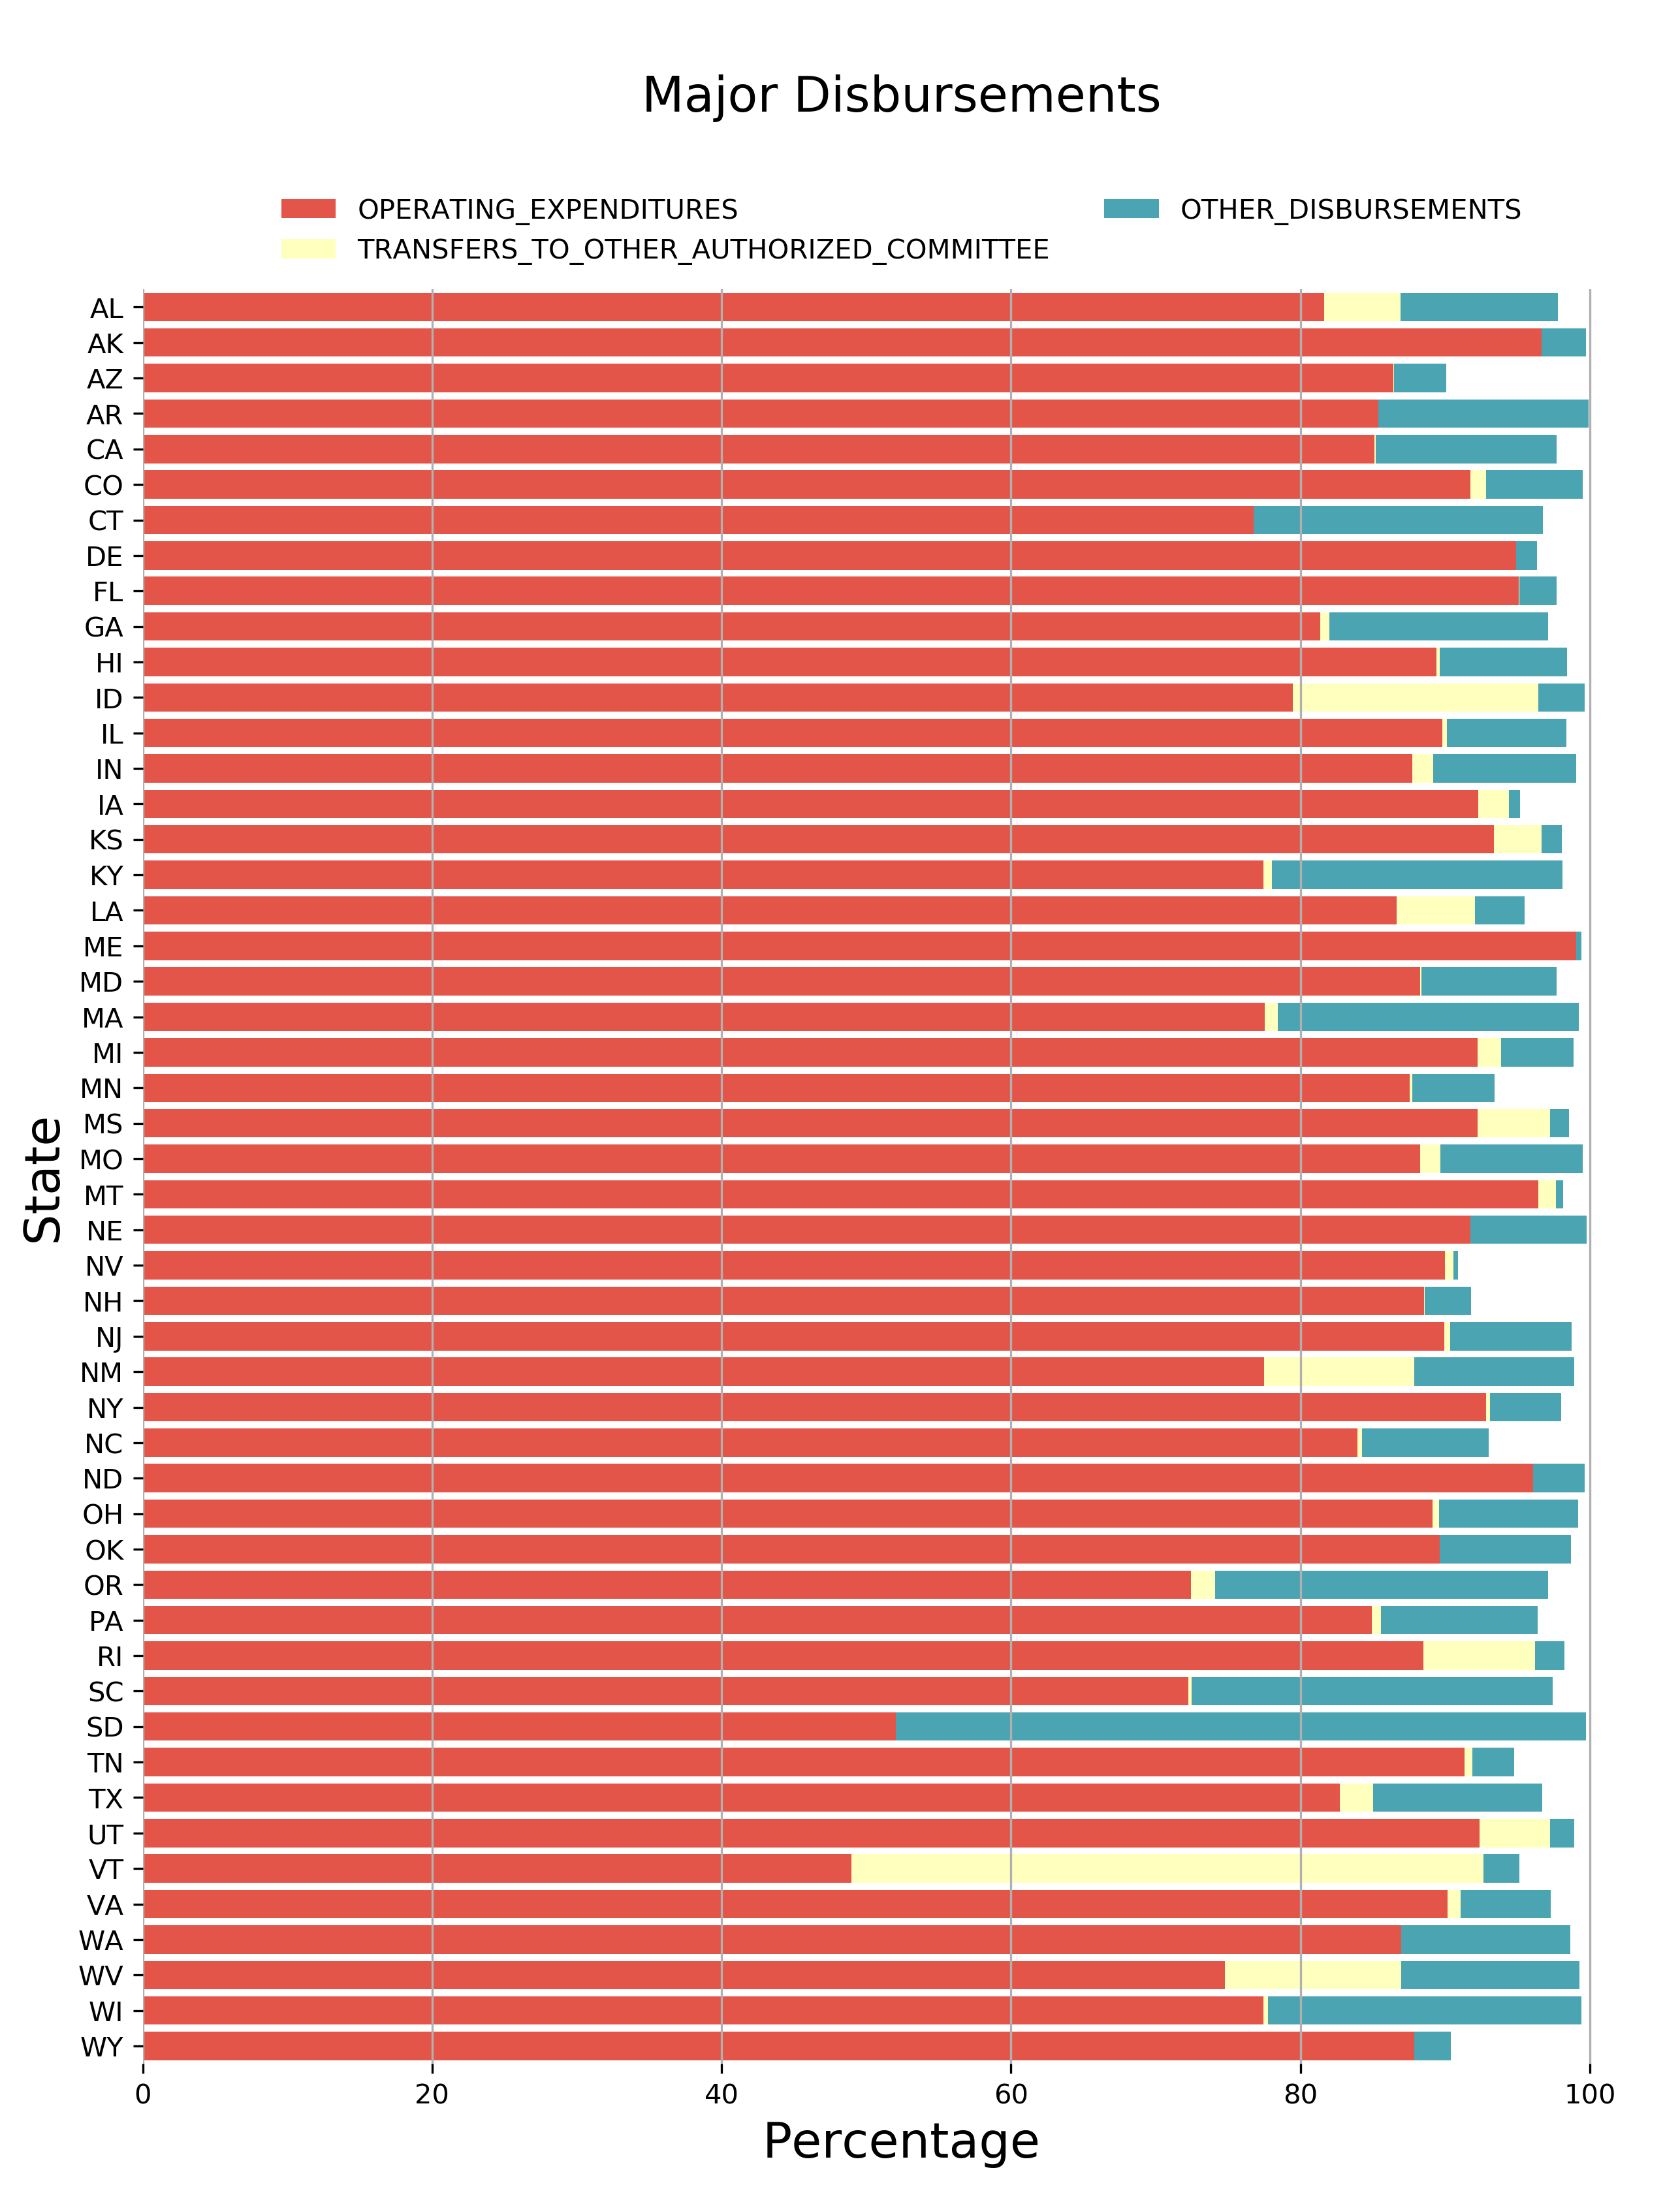
Chart 6: Major Disbursements
The above chart makes it clear that operating expenditures account for the vast majority disbursements (or spending). This is what we expected from such a high r-value above.
Next, let’s look at the correlation matrices for the numerical columns in results_pc_fr (receipts).
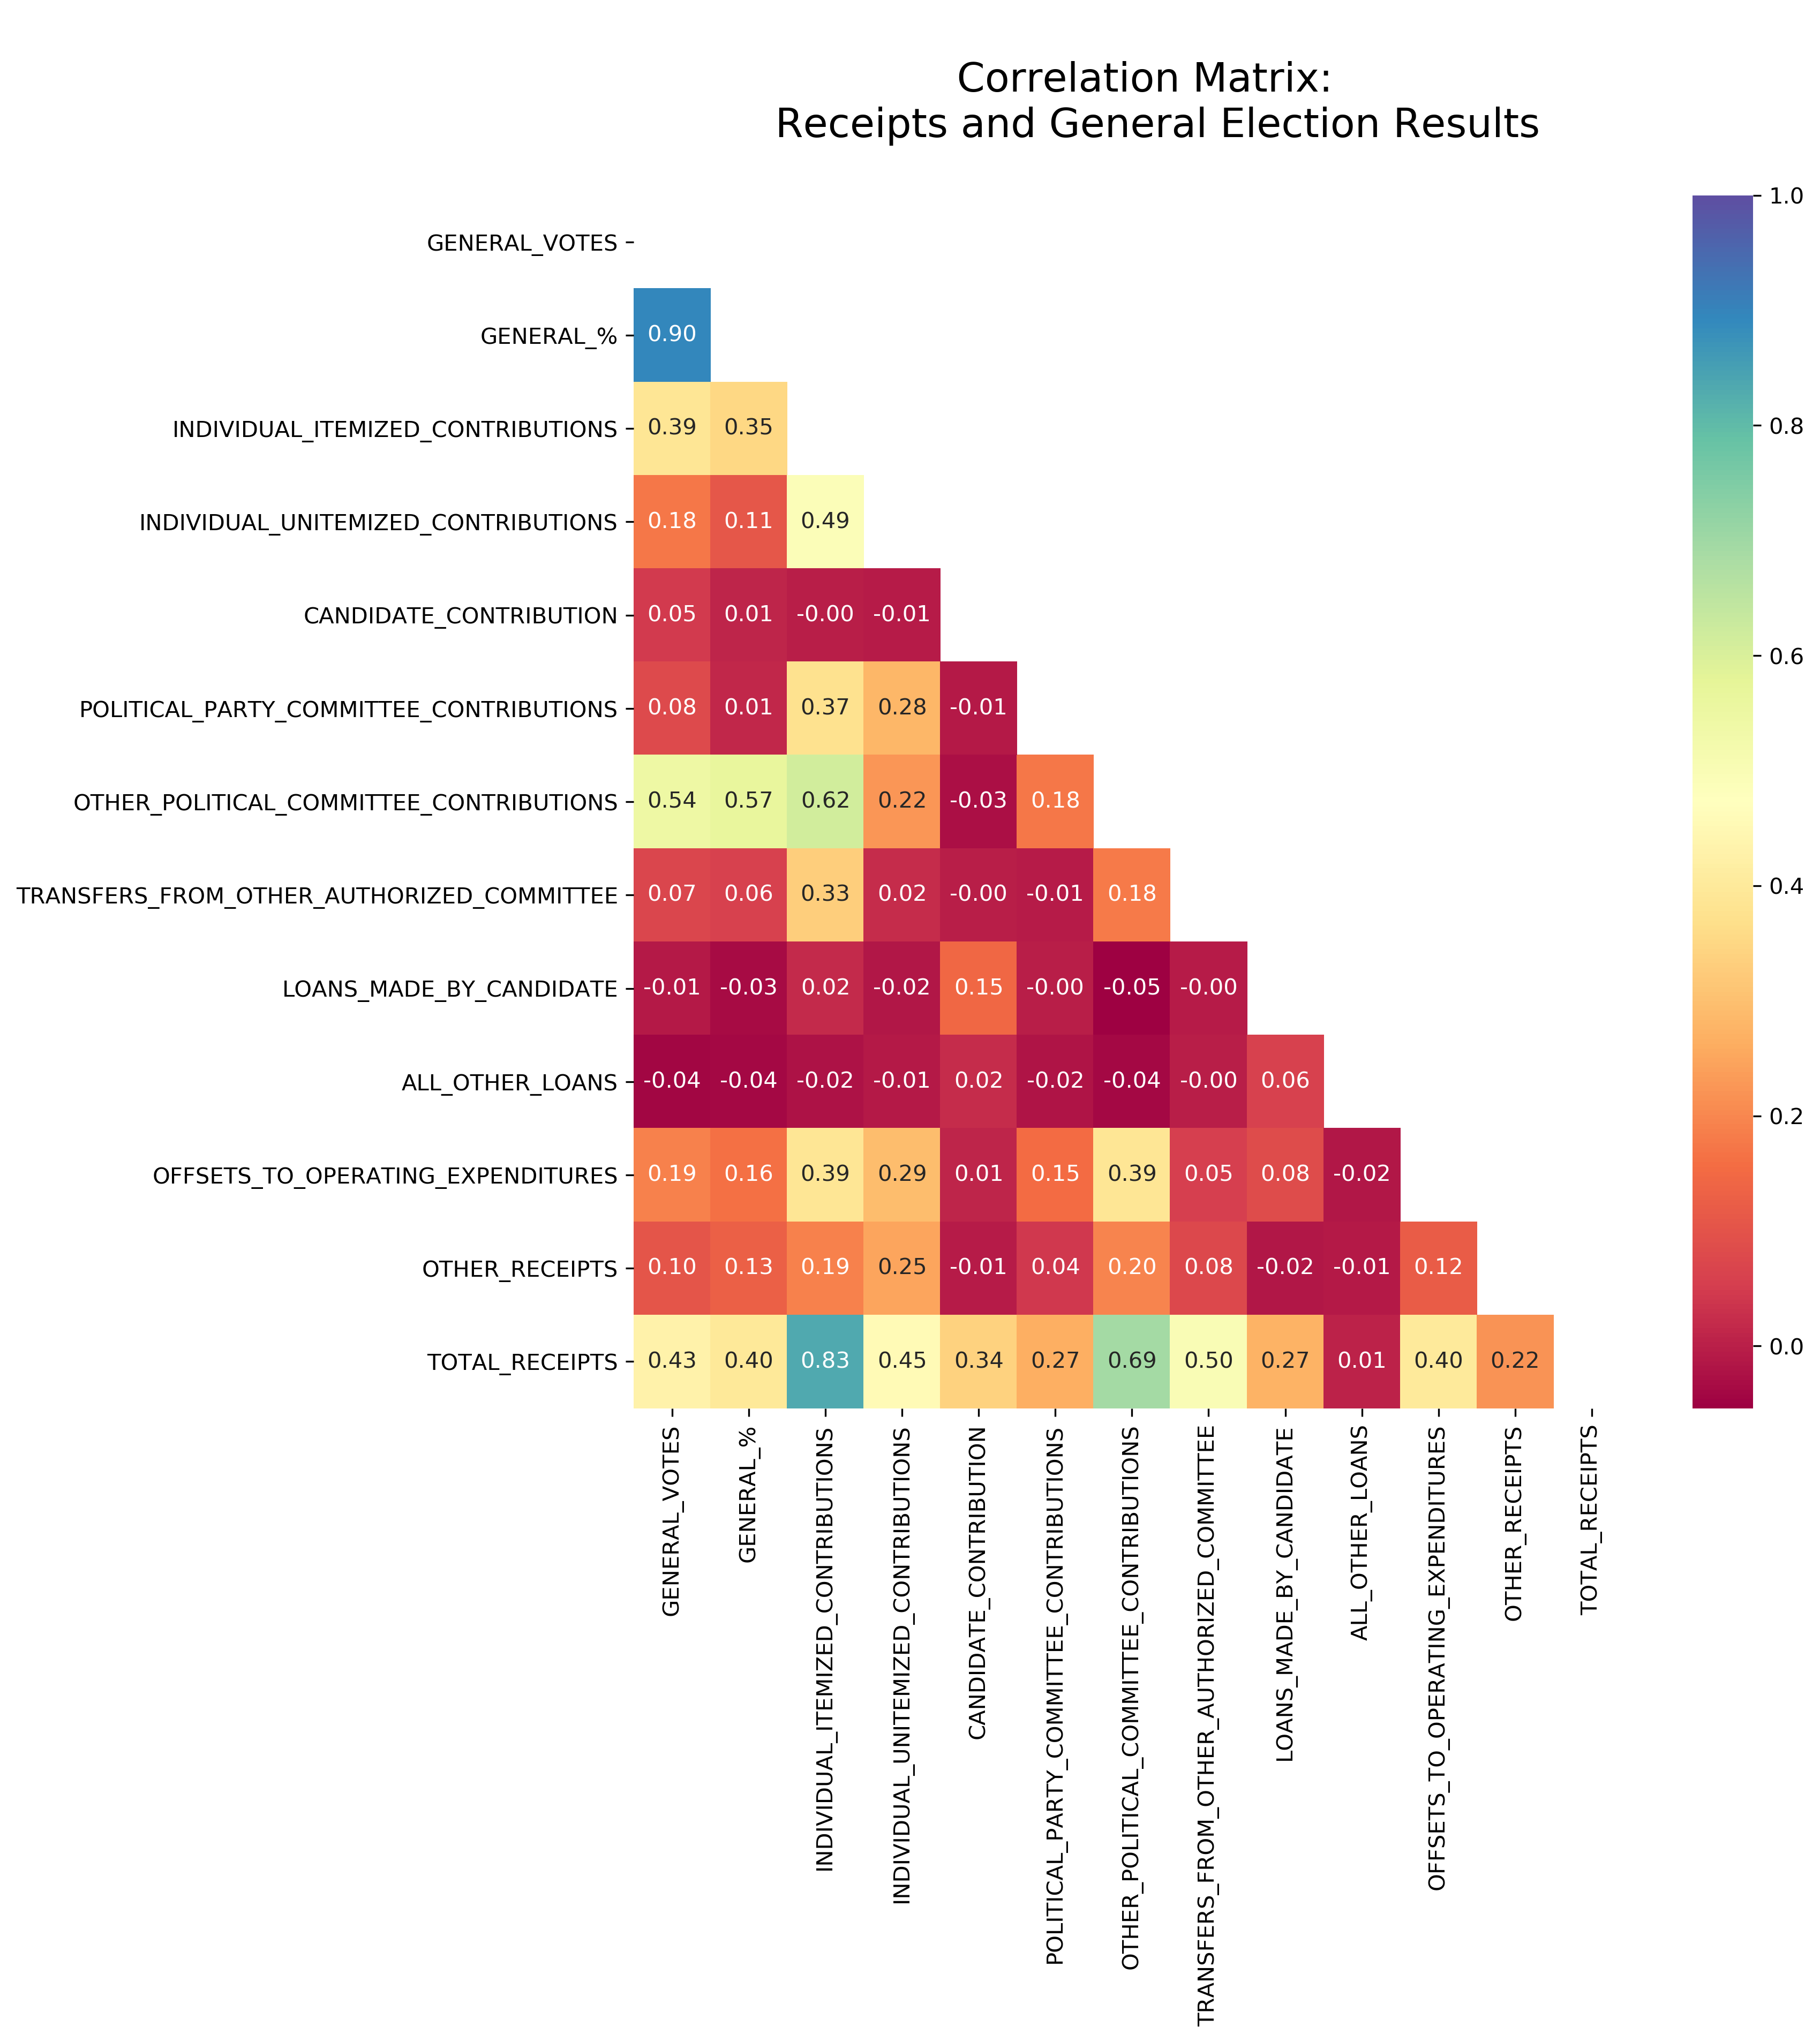
Chart 7: Correlation Matrix: Receipts and General Election Results
Again, there appear to be a few receipt-related columns that are highly correlated to ‘Total Receipts’, namely, ‘Individual Itemized Contributions’ (r=0.83), ‘Individual Unitemized Contributions’ (r=0.45), ‘Other Political Committee Contributions’ (r=0.69) and ‘Transfers from Other Authorized Committees’ (r=0.5). These categories might account for where the majority of funding comes from, on average, for most candidates.
There appears to be two, or three columns that have a moderately positive correlation with ‘General Votes’, these would be ‘Individual Itemized Contributions’ (r=0.39), ‘Other Political Committee Contributions’ (r=0.54) and ‘Total Receipts’ (r=0.43). The remaining columns have weak or no correlation to the general election votes.
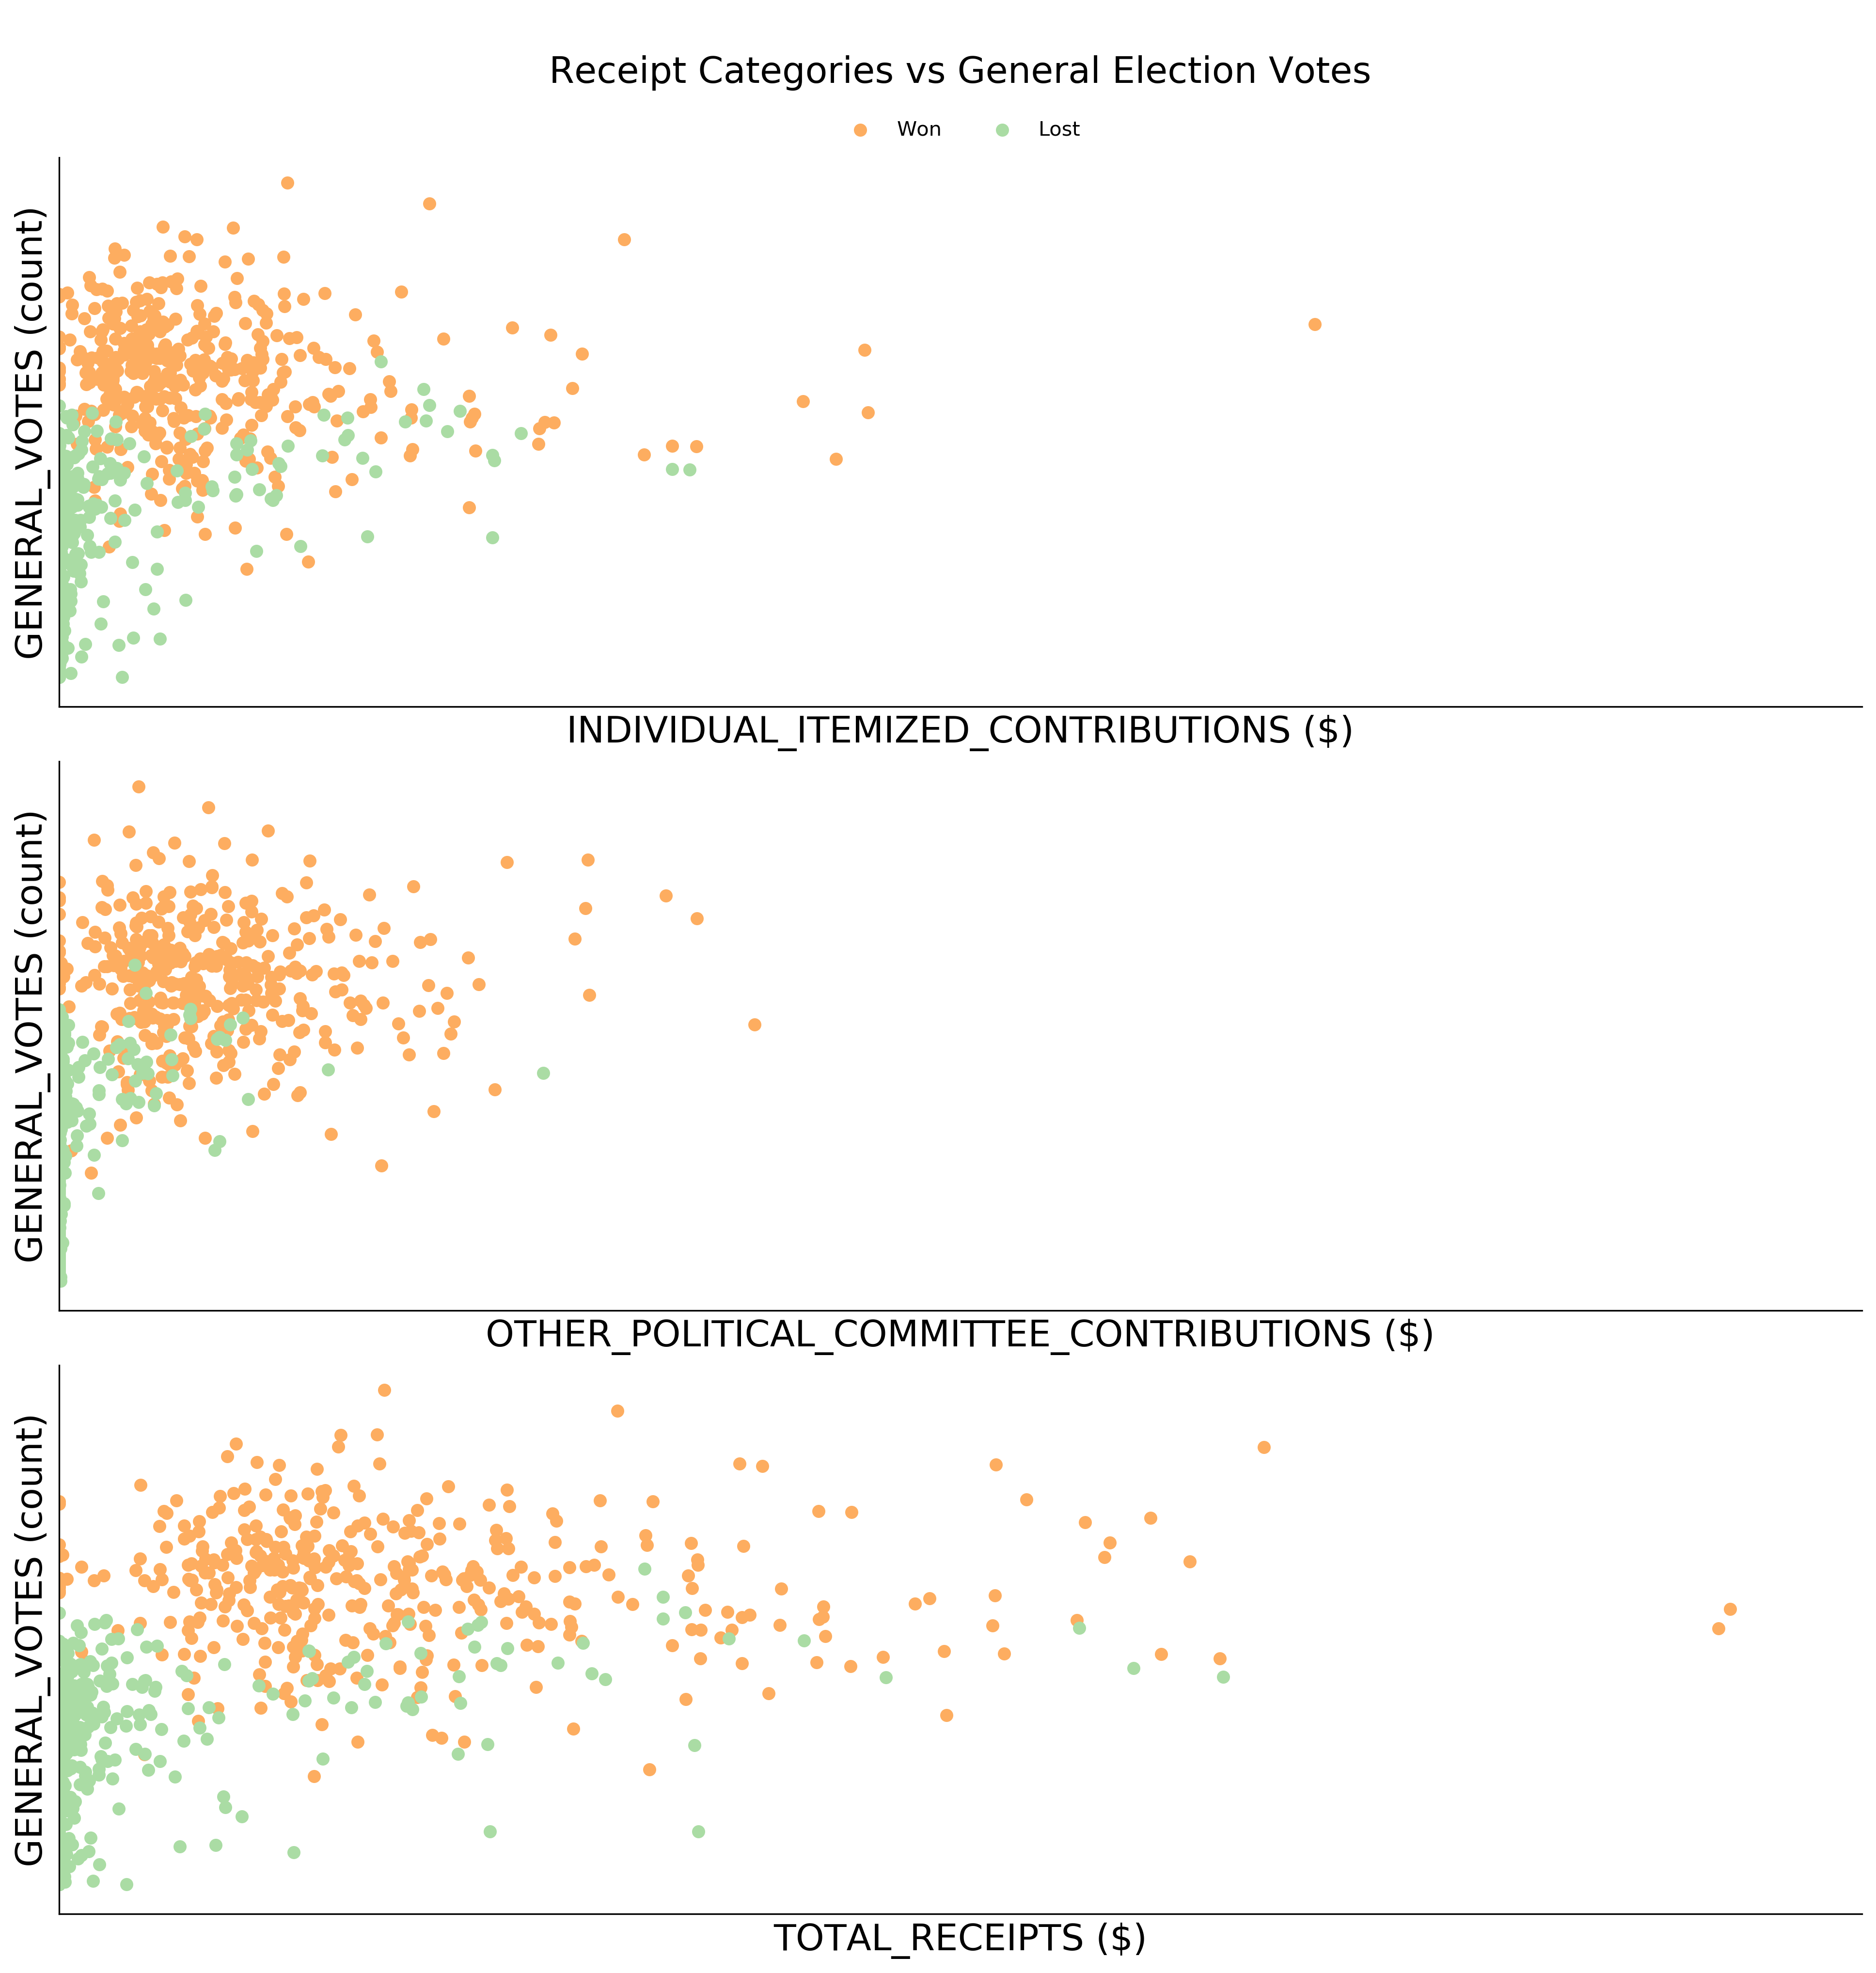
Chart 8: Receipts Categories vs General Election Votes
Like the scatter plots generated for disbursement columns versus general votes, the scatter plots generated for these three receipt columns appear to have similar shapes. That is the winners of the general election, in general, receive more contributions than their opponents.
Lastly, let’s explore where the majortiy of candidates contributions come from.
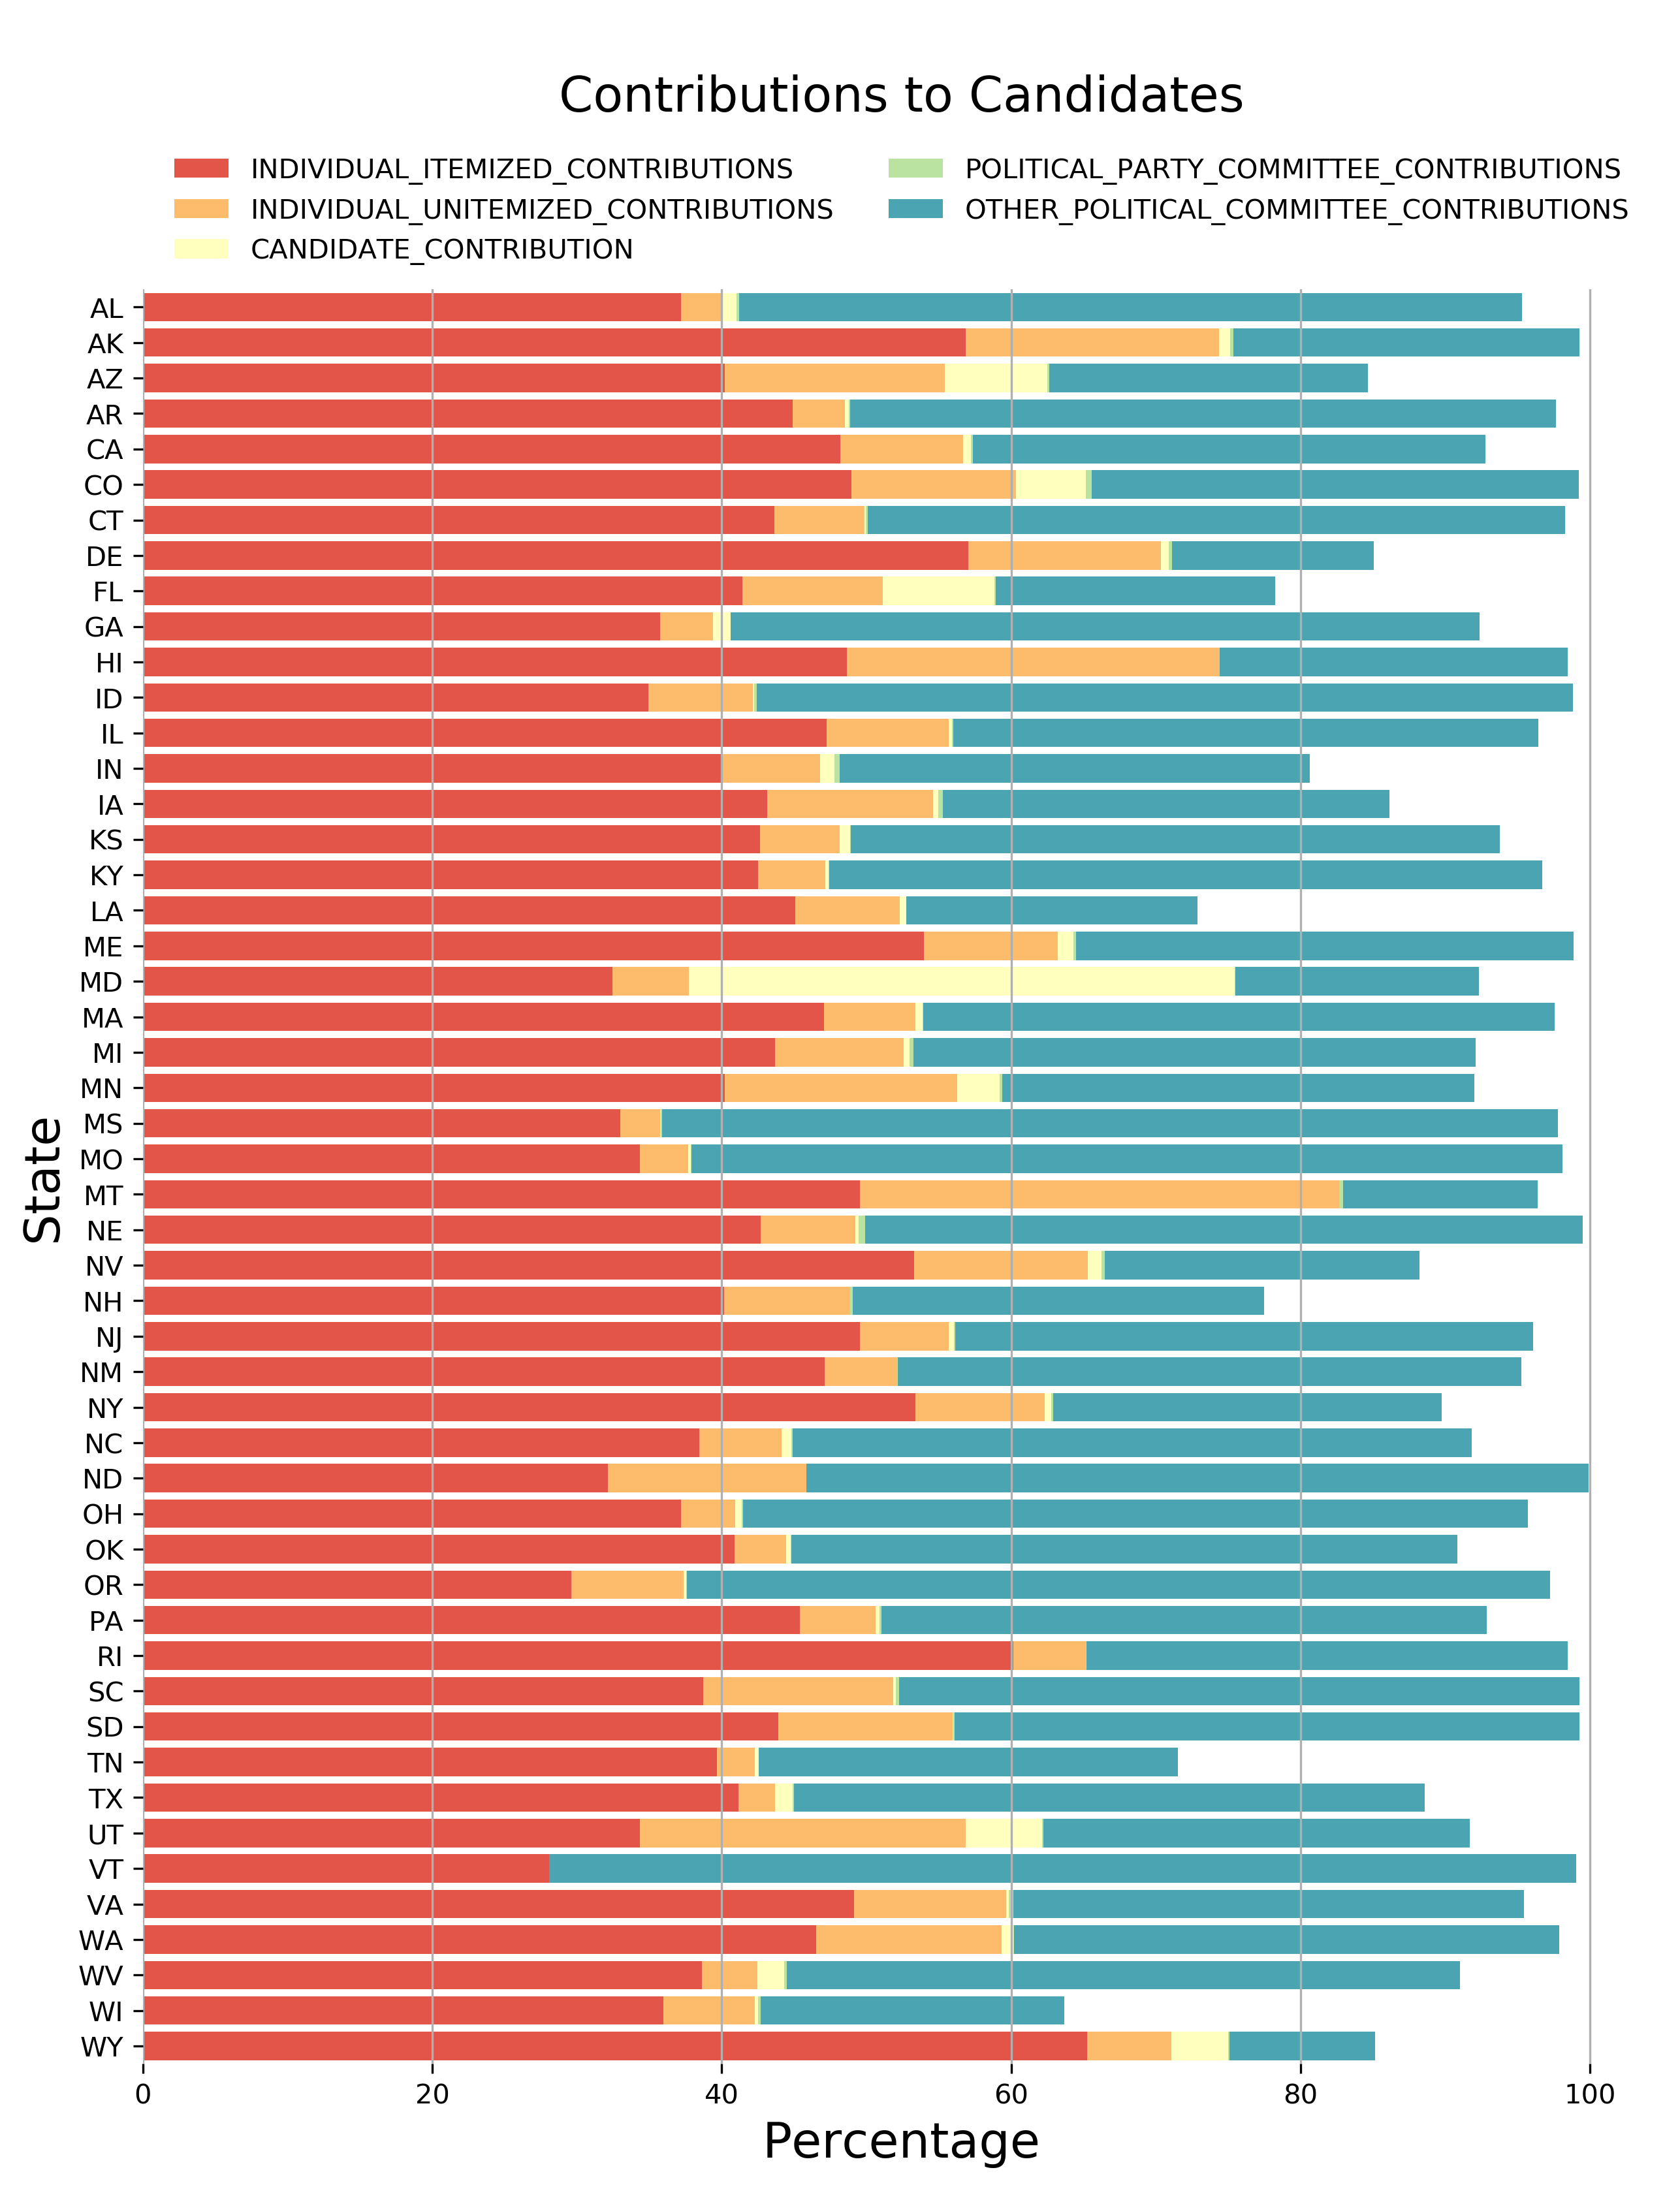
Chart 9: Contributions to Candidates
It appears that individual itemized contributions and other political committee contributions account for the majority of the funds raised (total receipts). This confirms the relatively high r-values seen for these two categories.
Wrap up
This analysis looked at the finances of the Principal Committees for (a majority of) the candidates who ran in the 2016 House of Representative elections. The question that was posed at the beginning of the analysis was, do the campaigns that spend the most money duing an election cycle end up winning the general election?
The answer appears to be yes. This doesn’t mean that this is always the case or that the correlation is particularly strong but the analysis shows that there appears to be some kind of relationship money spent (and raised) and election results. There are surely other factors and confounding variables involved such as whether or not the candidate was an incumbent or what the political leaning of the district in question looks like, however this analysis ultimately sparks in me a desire to keep investigating this relationship.
There are a lot more questions and other avenues through which to analyze the affect money has on election results and I intend to explore those further in the months to come. Here are a few thoughts and ideas I would like to explore:
- Perform a more in depth analysis of the Primary Election
- Perform a similar analysis for other years
- Perform a similar analysis for Senate and Presidential races
- Include other political committees in my analysis such as Joint Committees, PACs and Super PACs
- Create a Machine Learning algorith to predict the winners for upcoming elections